The Risk Adjustment Investable (Ra) Attribute evaluates the level of intervention required in a DARWIN by our Risk Engine.
Darwinex' Risk Engine acts as an overlay to the underlying strategy thereby ensuring that the DARWIN assets based on it trades with a maximum monthly target risk level of maximum 6.5% VaR.
The more the Risk Manager has to intervene, the lower the Ra score will be and vice versa.
This Investable Attribute is scored from 0-10 and is calculated taking into account the last 12 D-Periods of Experience (Ex).
DARWIN asset vs. underlying trading strategy
The lower the required intervention by our Risk Engine, the more similar the shape of the return curves of both the DARWIN and underlying strategy will be.
This doesn't mean the DARWIN and underlying strategy will have the same return, since DARWIN assets trade with a maximum monthly target VaR of 6.5%, while the monthly VaR of the underlying strategy can be anywhere from almost 0% to 99.99999%.
Known level of risk
The Darwinex Risk Engine transforms a strategy with a given risk into a financial asset - a DARWIN - with a maximum monthly target VaR of 6.5% at the 95% confidence interval level.
It should be noted that while the Risk Adjustment Attribute (Ra) evaluates the trader's risk management per position, the overall risk management of the trading strategy is measured by the Risk Stability (Rs) Attribute.
A stable risk level per trading account, combined with a consistent level of leverage per position, gives investors security that the shape of the DARWIN curve will be faithful to that of the underlying strategy. This combination results in high scores in both the Rs and Ra Attributes.
Where can I see the Risk Adjustment (Ra) score?
DARWIN Page
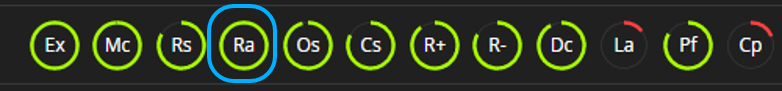
As with the other Investable Attributes, you can find this information in the upper right corner of a DARWIN page.
Investable Attributes tab
You need to go to the DARWIN page, click on the Investable Attributes tab and then on "Ra" in the horizontal menu.
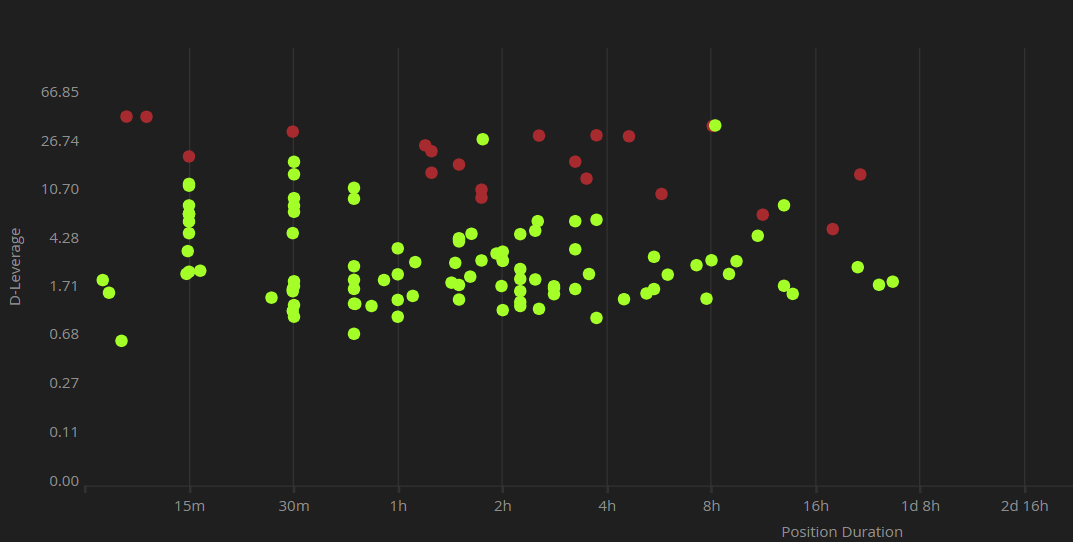
There you will find a bubble graph with 2 axes:
- The vertical axis (logarithmic scale) shows the D-Leverage per position in the trading strategy.
- The horizontal axis represents the duration of the position or length of time that it remained open.
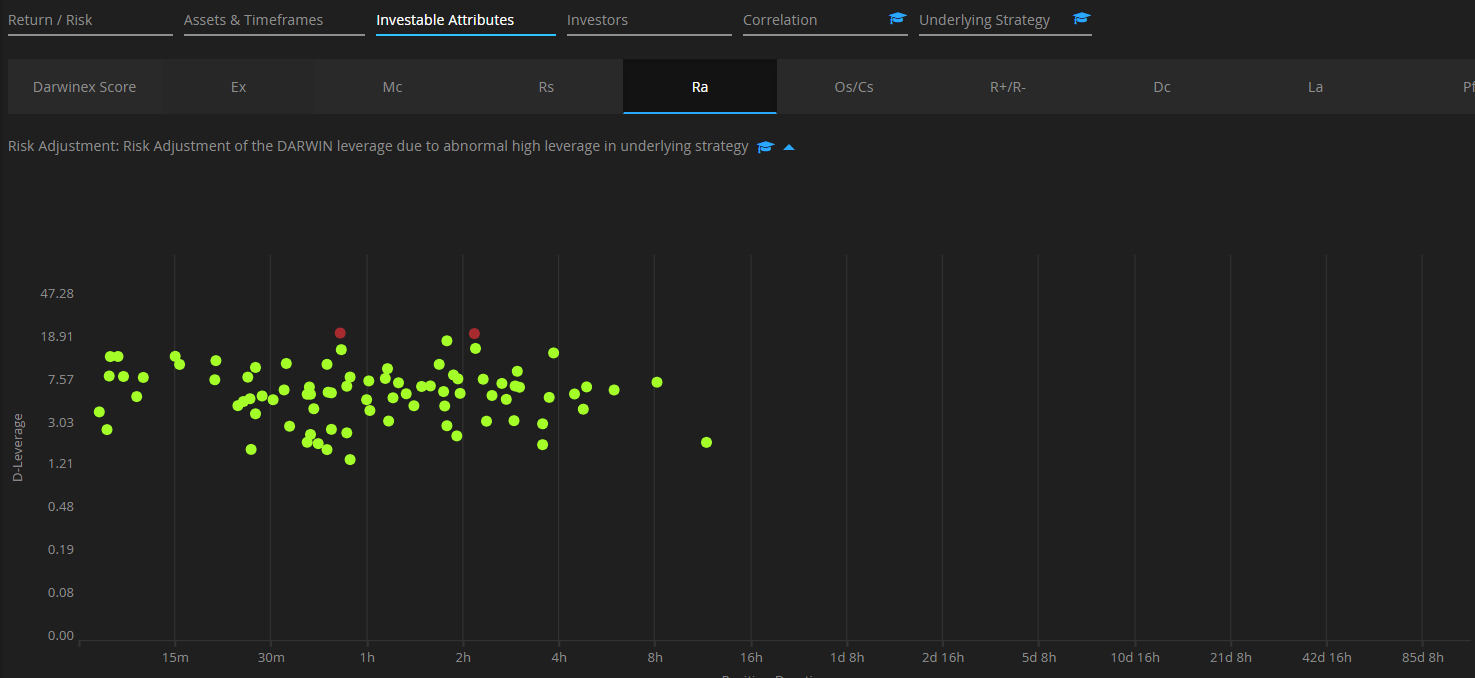
Additionally, you can observe three types of bubbles on the graph:
1. Green bubbles
Green bubbles represent positions that have not required intervention by our Risk Engine, as they have not significantly exceeded the average leverage of the recently opened positions on the underlying strategy.
2. Red bubbles
Red bubbles represent positions that have required intervention by our Risk Engine. In these instances, the leverage employed was considered too high relative to the average of recent positions.
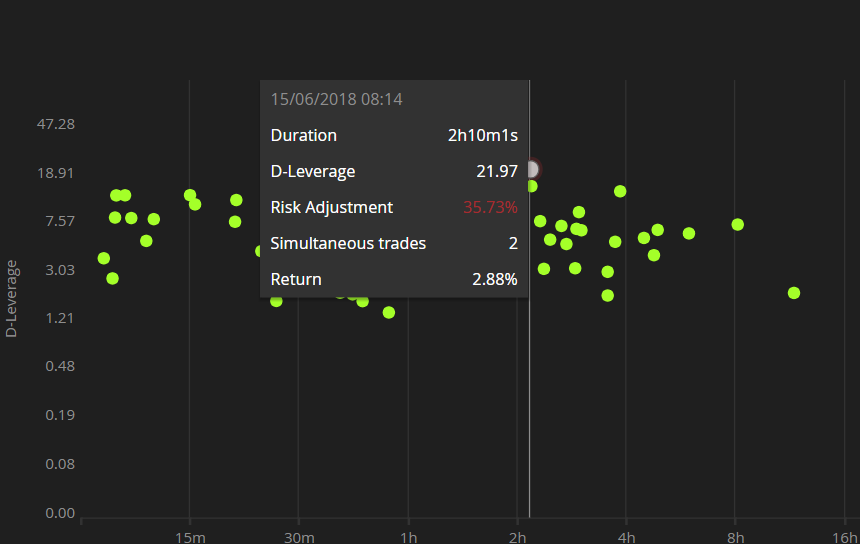
By moving your mouse over the bubble the exact size of the adjustment can be seen.
Logically enough, an adjustment of 5% can't be considered the same as an adjustment of 60% and an adjustment in the latter would provoke a much higher penalty to the Ra score than the former.
3. Orange bubbles
The Risk Engine can also intervene when the DARWIN leverage exceeds the following limits:
- For positions lasting less than 30 minutes, the maximum D-Leverage allowed will be 16.25.
- If a position lasts between 30 and 60 minutes, the maximum D-Leverage that a DARWIN could open is 13.
- Lastly, if the position lasts more than 60 minutes, the maximum D-Leverage would be 9.75.
This will be applied even if the DARWIN monthly VaR does not exceed a 6.5% VaR.
The orange bubbles, unlike the ‘red ones’, do not affect the score because we do not consider them to be a result of bad management by the trader.
Examples of Risk Adjustment (Ra) scores
As commented earlier, a graph full of green bubble is indicative of a strategy with a high Ra score.
Conversely, a graph full of red bubbles would be indicative of a strategy with a low Ra score.
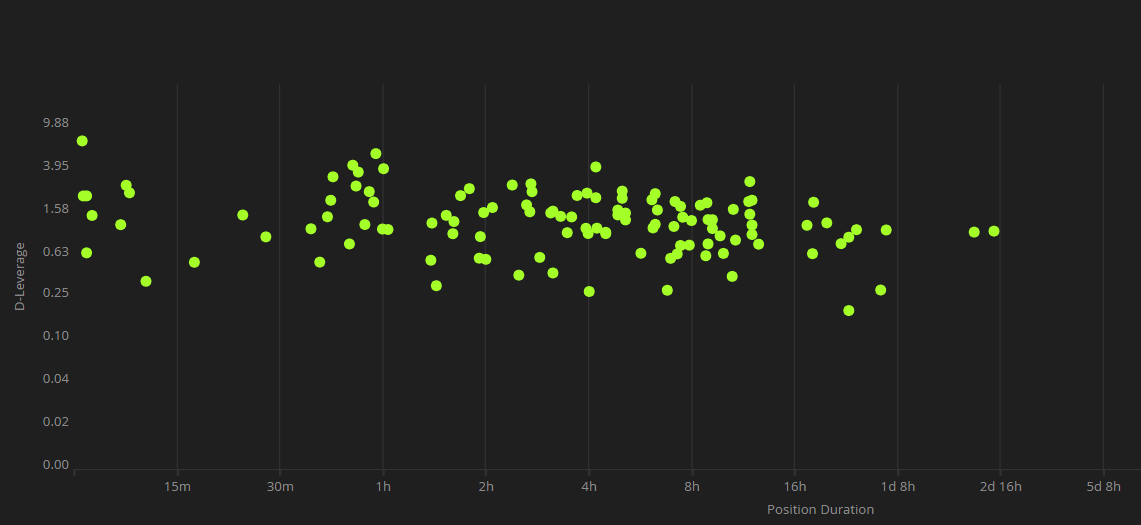
- High Ra score
The below graph, full of green bubbles, is a good example of the Risk Engine not having to intervene.
Consequently, the strategy will have a high Ra score.
- Low Ra score
The below example contains multiple cases of intervention by the Risk Engine.
Not only has the intervention been frequent, but also in many of those instances the adjustment required has been significant resulting in a low Ra score.
D-Leverage
D-leverage is the proprietary tool we use at Darwinex that measures the risk of a trading decision and is calculated with the following formula:
D-Leverage DARWIN = D-Leverage strategy * VaR DARWIN / VaR strategy * Risk adjustment
It is important to understand that the maximum leverage is defined as a function of the duration of the position, as the longer a position is left open, the greater the risk incurred.
As such the Risk Engine acts throughout the life of the position and not just upon the opening of the position.
Risk Engine behavior when faced with increased risk
The Risk Manager adjusts investor leverage in order to achieve a maximum target monthly VaR of 6.5%.
But what happens when a trader suddenly increases the risk of the strategy?
1. Increasing the number of trades in the same asset in the same direction
If a trader decides to open many trades in the same asset and same direction in short order, the D-Leverage will increase in line with the number of trades since the correlation between them is +1.
In this instance, the strategy VaR might not have time to update to reflect this new reality so the Risk Engine will recalculate a new VaR for the strategy - calculated across the last 45 trading days with open positions - and adjust the DARWIN positions in accordance with the formula outlined above so that the DARWIN D-Leverage does not drag the monthly VaR above the 6.5% target level.
2. Trades in different assets
If the new trades are open in different underlying assets than the ones that make up the position, the Risk Engine will evaluate the correlation between the new asset and the rest.
In the event of a sudden increase in D-Leverage due to high correlation with the existing trades, the Risk Engine will act in exactly the same way as the previous example.
The higher the correlation, the higher the risk and the bigger the adjustment.
Want to know more?
If you want to know more about the Risk Adjustment (Ra) Attribute, we encourage you to watch the following webinar recording.
Past changes to the Risk Manager
- 2020 - Why Max. 6.5% monthly VaR
- 2019 - Change from fixed VaR to variable VaR in the DARWIN assets
- 2017 - The New Risk Manager Part 1, Part 2 and Part 3