What is it?
Return refers to the financial result associated with an investment decision.
How is it calculated?
Darwinex calculates the return for a position or timeframe as a percentage of the equity used for a given position or at the start of a given timeframe.
The following information is taken into account:
- Closed trades / realized profit or losses
- Open trades / unrealized profit or losses
- Deposits & withdrawals* of money from the account. This is done so the percentage return is reflected correctly.
*By calculating return based on equity, deposits and withdrawals do not affect the percentage return. This is done so that a trader can't artificially skew his results by depositing or withdrawing money.
Example
1- A trader with €1,000 in his account opens a trade that is generating a profit of €50 (5%).
2- Before closing the position he decides to withdraw €950.
3- Seconds later, he closes the trade.
Darwinex splits this trade into 2 positions with the following result:
Position 1 (finishes before the withdrawal of €950):
- Initial Equity => €1,000
- Final Equity => €1,050
- Return => 5%
Position 2 (starts after the withdrawal of €950 and finishes with the trade being closed):
- Initial equity => 100 €
- Final equity => 100 €
- Return => 0%
- Compound return of both positions => 5%
Where can I see it?
In Darwinex it is important to distinguish the DARWIN return from that of the underlying strategy.
- DARWIN
On the DARWIN profile page, you can see the return chart for one of the pre-set timeframes offered by Darwinex (TOTAL, 2A, 1A, 6M, 3M, 1M, 1W y 1D).
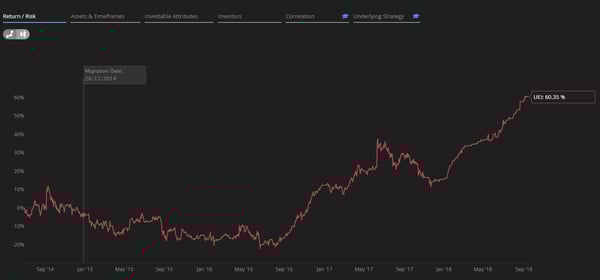
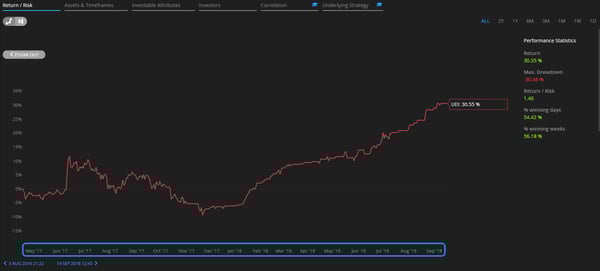
By left-clicking and dragging on the mouse, you can zoom in on a specific period to see the % return for a custom time period.
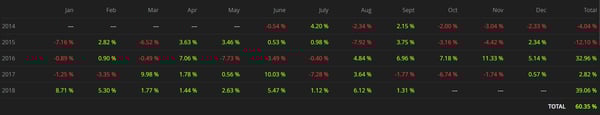
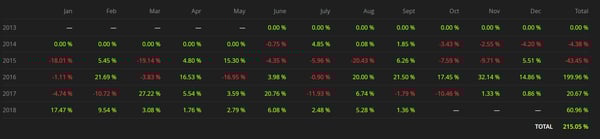
Right below, there is a table showing returns per month, year and since the inception.
- Underlying strategy
As with the DARWIN, you can see the equity return curve of an underlying strategy in addition to a summary table displaying monthly/yearly/total returns.
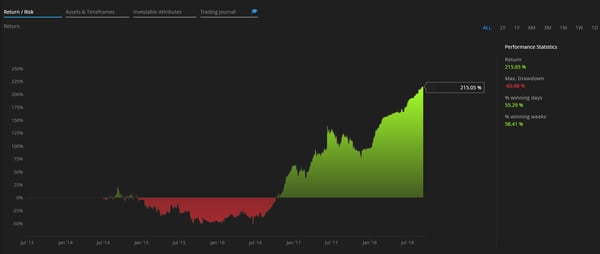
The return chart of the trading strategy does not permit zooming.
However, this can be done by switching to the Trading Journal.
Update frequency
- Return on both DARWINs and their underlying strategies is updated every 30 seconds.
- Return of live trading strategies without DARWIN and of demo trading strategies is updated once a day, during the European nighttime.
Tips
- It's not just about the return
Remember that there is more to a good strategy than just its return.
Past results are no guarantee of future returns and as such. Therefore, it is recommended that you understand the Investable Attributes of a DARWIN / strategy to determine whether a return has been achieved by skill or by luck.
- Return on summary tables is compounded and not summed
The total cumulative return does not match the sum of the monthly returns.
This is because the cumulative return over a period is calculated by compounding the returns of the constituent sub-periods, and not by simply adding them up, by using the following mathematical formula:
[1+(R1/100) * 1+(R2/100) * 1+(R3/100) * 1+(Rn/100) ... -1] * 100
*R = return in %