What is it?
Open Strategy (Os) and Close Strategy (Cs) Investable Attributes measure how skilled the trader is when opening / closing its trades.
It assesses the quality at the entrance / exit of trades and comparing their profitability with that of 10 simulations that systematically enter and exit the market either a bit earlier or later than the trader.
Os and Cs are scored from 0-10 and take into account the last 12 D-Periods of Experience (Ex).
- Open Strategy (Os)
Measures if the profitability of the strategy would have improved if the trader had opened trades a bit earlier or later.
The better the score, the more accurate the trader at opening trades.
- Close Strategy (Cs)
Measures if the profitability of the strategy would have improved if the trader had closed trades a bit earlier or later.
The better the score, the more accurate the trader at closing trades.
How is Os/Cs calculated?
Open strategy (Os)
We simulate the return of 10 hypothetical trades that open 10%, 20%, 30%, 40%, and 50% before and after the actual real trade.
Once the simulations are done, we classify all trades per return and assign them the following reference scores (not to be mistaken for the final attribute score):
- 1 => first place
- 2 => second place
- 3 => third place
- ...
- 11 => last place
With all the reference scores accumulated in the Os Attribute, an arithmetic average is worked out, and the final score is calculated.
The closer to 1 the reference score is, the closer to 10 the final score for is Os Investable Attribute is, and vice versa.
Close strategy (Cs)
Together with the original trade's return, the returns of 10 hypothetical trades are simulated which close 10%, 20%, 30%, 40%, and 50% before and after the original trade.
Once the simulations are done, we classify all trades per return and assign them the following reference scores (be careful not to confuse this with the final Cs score):
- 1 => first place
- 2 => second place
- 3 => third place
- ...
- 11 => last place
With all the reference scores accumulated in the Cs Attribute, an arithmetic average is worked out, and the final score is calculated.
The closer to 1 the reference score is, the closer to 10 the final score for is Cs Investable Attribute is, and vice versa.
Where I can see the data for the Os/Cs Investable Attributes?
As with all of the Investable Attributes at Darwinex, you access them either through the relevant icons (Os/Cs) on the main DARWIN/strategy page or through the tab ''Investable Attributes'' - ''Os''/''Cs''.
- Attributes bar

NOTE: If you hover the mouse over any Investible Attribute, you will be able to see both the current score and a brief description.
- Investible Attributes tab. ("Investible Attributes" - "Os"/"Cs")
- Open Strategy Graph (Os)
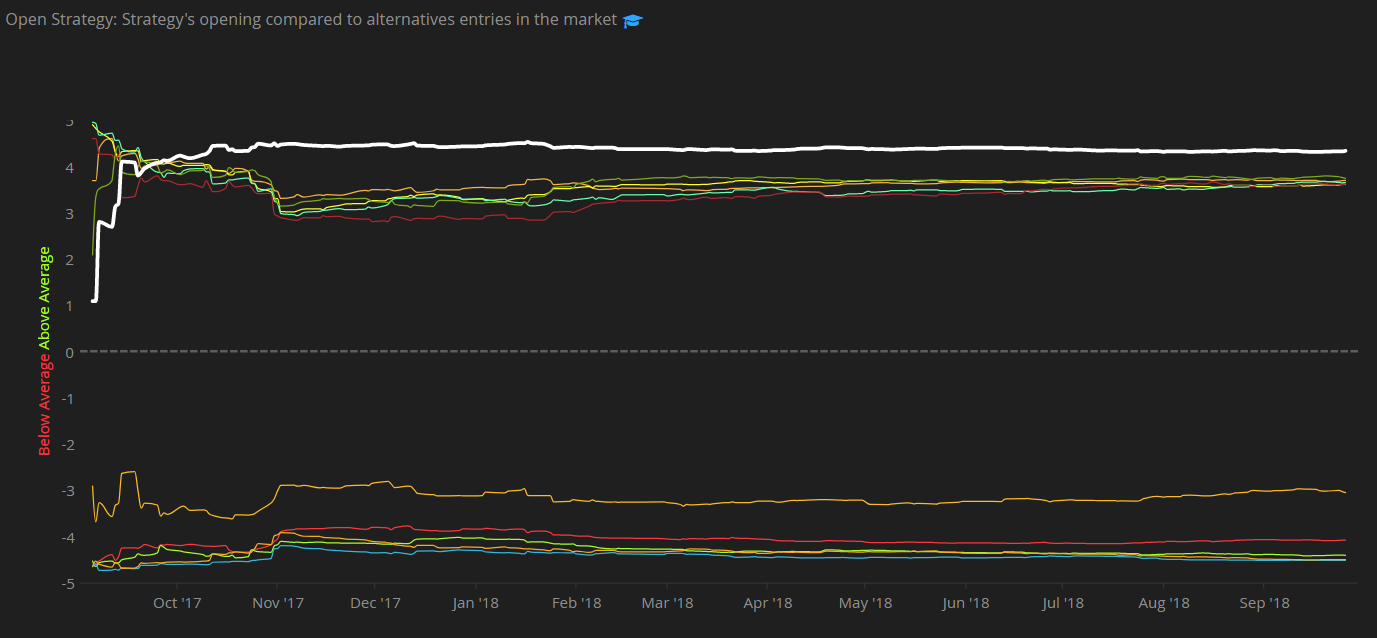 The higher up the white line is in the graph, the better the score reflects in the Os Attribute.
- Close Strategy Graph (Cs).
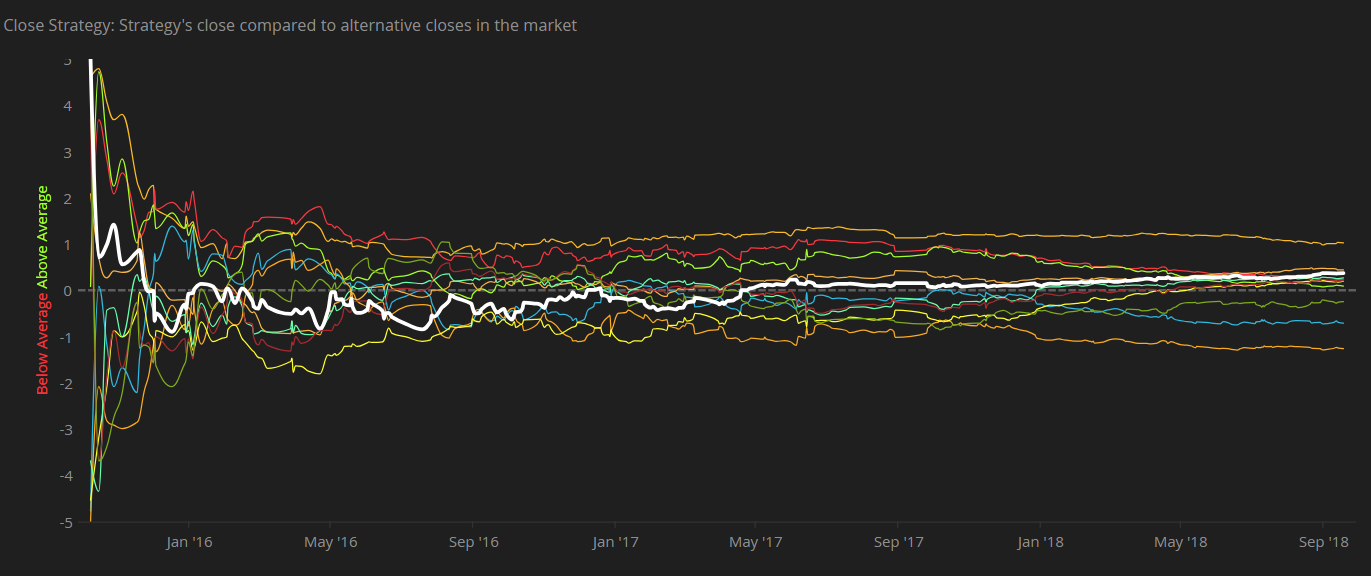 The higher up the white line is in the graph, the better the score reflected in the Cs Attribute.
Tips
- Kaizen: constant improvement. The Os/Cs Attributes can help traders improve their entry and exit points since they will know perfectly if they enter/exit too early/late.
- Perfection does not exist. It is very difficult for a strategy to achieve good scores in all of the Investable Attributes, therefore you may find good DARWINs with low scores in Os/Cs.
Learn more
Fine-Tuning Trading Systems by Analyzing Trade Open and Close Data
Backtesting and Optimization Processes are of course essential activities for any algorithmic trader.
But what about using live trading data to help to fine-tune your trading system?
This video shows you how.
Trade Entry and Exit Timing Optimization for Algorithmic Traders
How can you use your past live trading history to help you fine-tune your algo trading system?
This video shows how the Darwinex timing metrics can help you achieve this.