Introduction
At Darwinex you can trade with forex, as well as CFDs such as the most widely-known indices, commodities, and stocks.
A trade is nothing more than a sales agreement in any one of these assets. Therefore, a trade starts with the purchase of an asset, and it ends with its sale.
Its risk is determined, amongst other factors, in terms of the leverage used by the trader.
Darwinex analyses the risk per position and not per trade, meaning that it calculates the accumulated risk exposure of all the trades opened simultaneously.
If you only have one trade open, position and trade are the same.
However, if you have various trades open simultaneously, a position will be made up by the combination of all these trades.
In other words, you will have created a synthetic asset that does not necessarily coincide with any of the individual assets.
A position is closed when a new trading decision is taken, that is when you buy/sell, or deposit/withdraw capital.
How is the risk per position calculated?
1. Volume
If one of the trades which makes up the position constitutes much more volume than the rest, the risk of the position will be largely determined by the progress of that trade.
2. Volatility
The more volatile the assets that compose your position are, the greater the risk of that position.
3. Correlation
The higher the correlation between all the assets in your position, the larger the risk of that position.
4. Duration
The longer a position's duration, the larger its risk will be.
At Darwinex we value traders for their ability to maximize the return per position whilst minimizing their risk.
The risk per position is measured thanks to the D-Leverage.
Case Study
Let's bring in some practical examples to help you better understand the concept of position.
In each one of the examples we will use the following data:
- EURUSD: @ 1.20500
- EURGBP: @ 0.88000
- GBPUSD: @ 1.36932
Case study 1
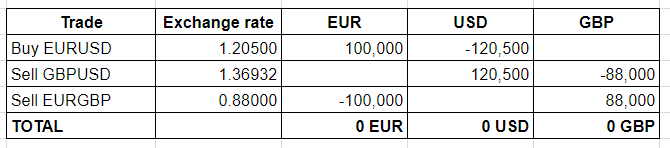
Calculate the trader position which is carrying out the following trades:
- Long (buy) EURUSD @ 1.2050 with a volume of 1 lot (100,000 EUR)
- Short (sell) GBPUSD @ 1.36932 with a volume of 0.88 lots (88,000 GBP)
- Short (sell) EURGBP @ 0.8800 with a volume of 1 lot (100,000 EUR)
Solution
The individual analysis of each trade carries a market risk.
However, if we analyze the synthetic position that has been created, we will see that in reality, the market exposure is null:
Case study 2
Taking into account the trades carried out by a trader in case study 1, it shows that the economic effect of said position is null when the exchange rates have changed to the following levels:
- Long 1 Lot EURUSD @ 1.2050, with the EURUSD now @ 1.2200
- Short 0.88 Lots GBPUSD @ 1.36932, with the GBPUSD now @ 1.41860
- Short 1 Lot EURGBP @ 0.8800, with the EURGBP now @ 0.8600
As always, the new exchange rates are connected, as 1.22000 / 0.86000 = 1.41860
Solution
In order to solve this case, we will calculate the economic impact, in EUR, of the change in exchange rates on the three trades.
In particular, you will obtain a result given in the listed currency that you will have to convert to EUR using the new exchange rates.
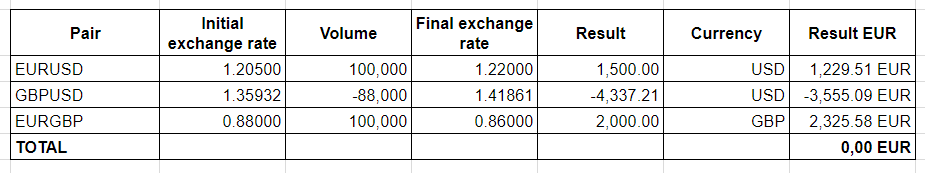
It can be observed that the economic effect of the synthetic position, made up of the 3 trades, is null.
Therefore, Darwinex considers said position as ''null'' and it will not generate Experience (Ex).
Case study 3
Faced with an upcoming news release, the trader decides to carry out the following trades:
- Buy 1 lot EURUSD @ 1.2250 a Stop Loss @ 1.2220
- Sell 1 lot EURUSD @ 1.2249 a Stop Loss @ 1.2280
The key event provokes an appreciation of the EURUSD @ 1.2300, and as a consequence triggers the SL at a sale @ 1.2280.
We ask you to calculate:
- The position risk that the trader had just before the news release.
- The position risk that the trader had after the EURUSD movement to @1.2300.
- How could the trader have replicated the position saving on execution costs?
Note: for this example, we do not take into account the possible spread increase, commissions, etc.
Solution
We will analyze each answer one by one.
1. As we have seen in the previous exercises, the position risk that the trader has before the new release is null.
In this case, Darwinex considers the position to be null with a D-Leverage of 0 because the market movements will not provoke any economic result.
2. Once there has been a market movement produced @ 1.2300, triggering the SL of the second trade (Sell USD @ 1.2249 SL 1.2280), the trade has long (buy) trade (in this case also a position) on the EURUSD @ 1.2250 for 100,000 EUR (1 lot).
The position with risk exposure is generated at @ 1.2280, at which moment the sell trade disappears.
It would therefore be the same as having bought the EURUSD @ 1.2280, and not @ 1.2250 as it would show on the trader's daily trades.
3. The trader has executed two trades, paying the relevant commissions for each one, when they could have replicated the trades with less execution cost by carrying out the following orders:
- Buy Stop EURUSD @ 1.2280 SL 1.2220
- Sell Stop EURUSD @ 1.2220 SL 1.2280
Of course, in this case, once a trade has been executed, you would have to delete the pending order.
Tips
Now we will go on to analyze the differences between position and trade in terms of the Investable Attributes Experience (Ex), Loss Aversion (La), and Positive and Negative Return Consistency (R+/R-).
1. Experience (Ex)
In terms of D-Periods accumulated in the Investable Attribute Experience (Ex), the final result in the cases below would be exactly the same:
- Open a long trade on the EURUSD of 1 lot.
- Open, consecutively, in a short space of time, 10 long trades on the EURUSD of 0.1 lots.
In other words, you cannot accumulate more D-Periods of Experience (Ex) by fractioning a trade in a short period of time.
2. Loss Aversion (La): Position vs. Trade
The Loss Aversion (La) Investable Attribute shows us the maximum positive/negative excursion per position in the same underlying asset.
If you want to see the maximum positive/negative excursion per trade, you will need to go to the ''Assets & timeframes'' tab.
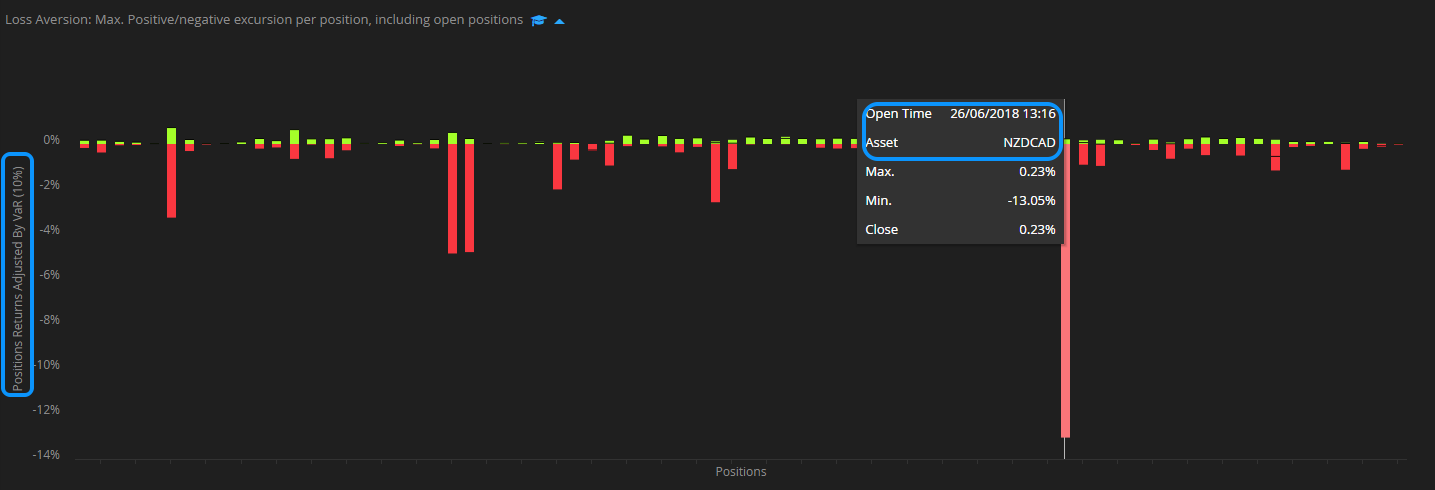
Loss Aversion Investable Attribute chart (excursion per position)
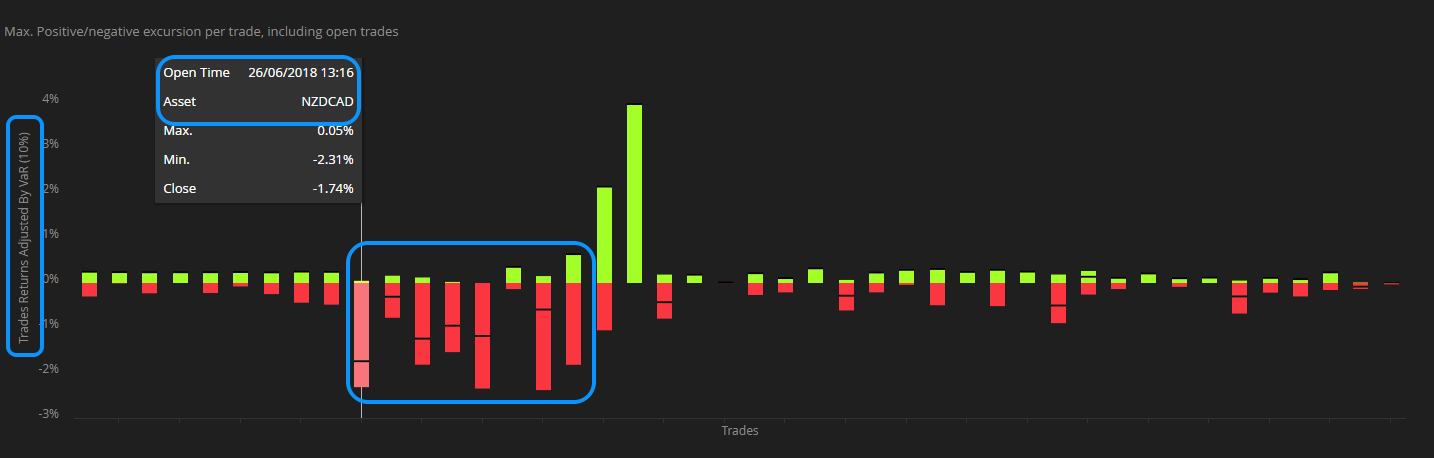
Assets & Timeframes section: excursion per trade
3. R+/R-: Position vs. Trade
Similar to the Loss Aversion (La) Attribute, the Positive/Negative consistency (R+/R-) charts show the information in terms of the position in the same asset.
In case you wanted to check individual trades, you will need to go to the ''Assets & timeframes'' tab.
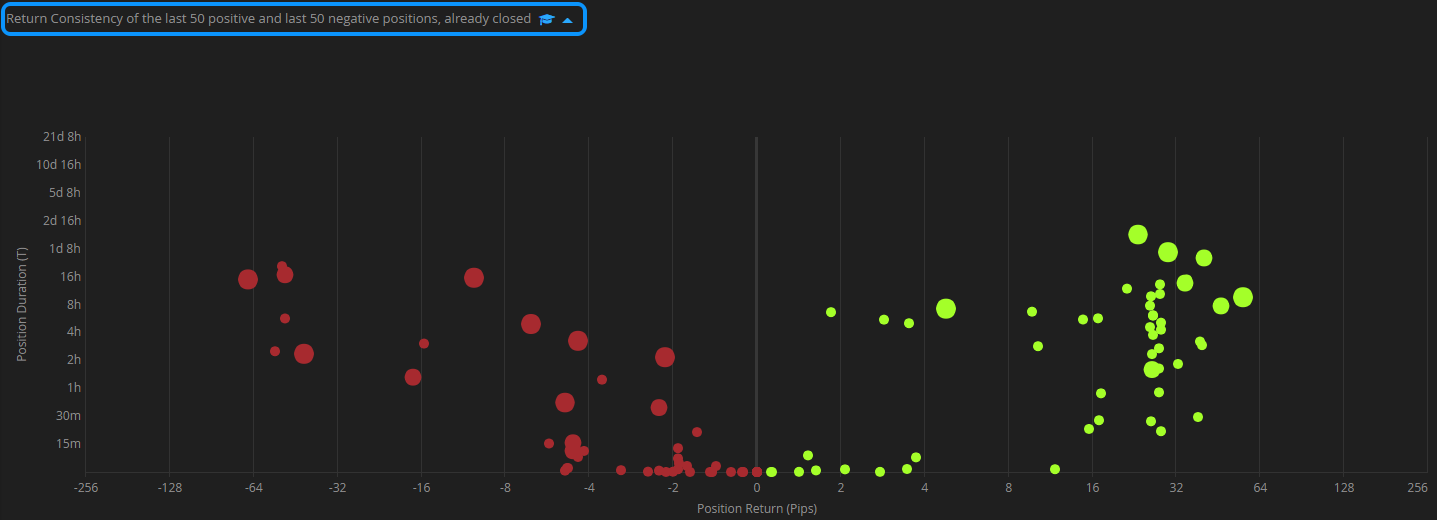
R+ and R- chart showing return and duration per position
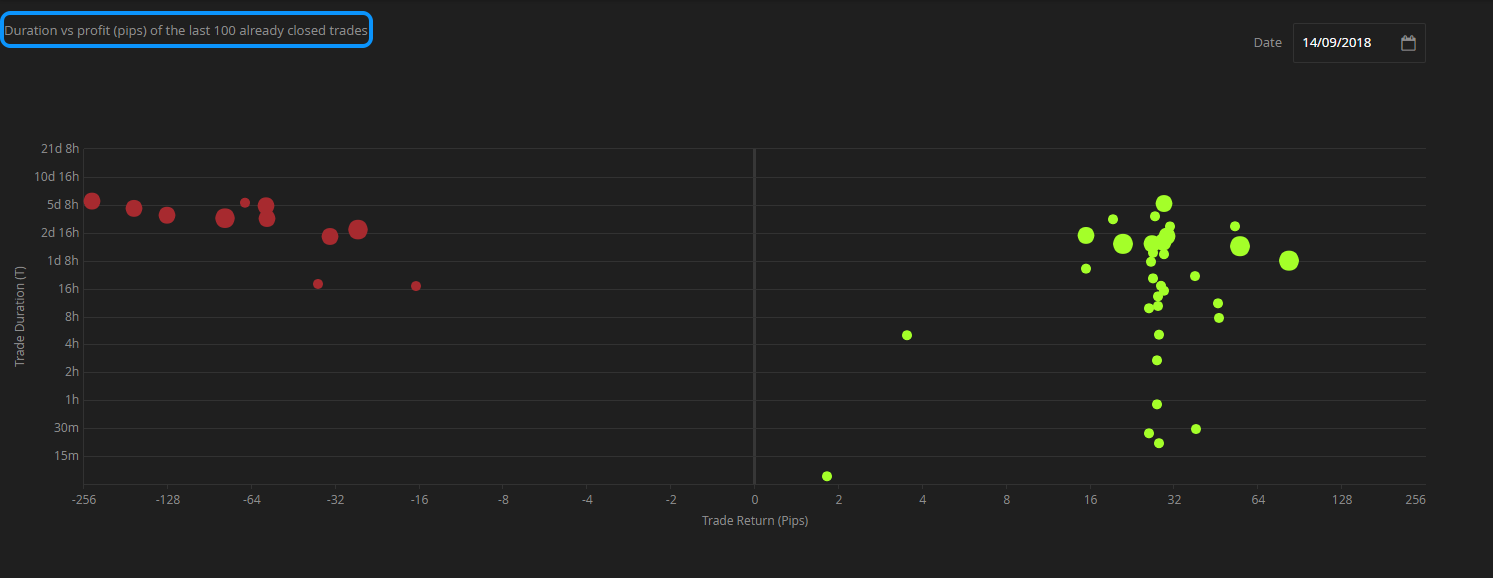
Return and duration per trade in Assets & Timeframes section