The Investor Divergence section of the Asset Management portal provides information on the execution of investor orders directly generated by orders from the strategy underlying the DARWIN.
This information is provided only to our DARWIN provider to analyze the factors that influence the divergence affecting their investors and take action to improve it.
The Investor Divergence comes with 3 sections:
- Info DARWIN
- Strategy and investors' orders and
- Net strategy and investors' positions.
Table of contents
1. INFO Darwin
In this section, the DARWIN whose divergence information is to be viewed is selected.

The exact target VaR and VaR ratio is shown here for the selected DARWIN asset.
Read the article about the Risk Engine to know how target VaR and VaR ratio are calculated.
It also displays information about the invested capital (in $), the number of investors, the monthly divergence, and latency.
2. Strategy and investors' orders
This section shows the orders executed by the underlying strategy and the orders that have been consequently executed for all investors (provided that there were investors in the DARWIN at the time of the strategy order).
For each strategy order, there will be an investors’ order (1 single order for all investors).
Only investors’ orders whose symbol corresponds to the symbol of the strategy order are displayed. I.e. if there is already an open position in EURUSD and the strategy trades in EURGBP, associated with this order in EURGBP, only the investors’ order in EURGBP will be displayed; potential risk adjustment orders in EURUSD will not be displayed.
It is broken down into 4 parts.
a) Order navigation and filtering
It makes it possible to filter the orders to be viewed in the graphs and the list.

It has the following options.
- Search: entering the trading platform ticket number will display the two orders (opening and close) associated with it.
For MT5 accounts the number of the order is not displayed for the time being; thus, searching per ticket number won't work for MT5 accounts.
- Filters: shows/hides the different parameters according to which the orders can be filtered (described below).
- Number of orders: the number of orders to be viewed in the graph and list.
- To date: the number of orders that meet the filter criteria, which date (of the strategy order) is prior to the to date, is displayed.
- Chart icon: shows/hides the chart that displays the evolution of divergence and invested capital over time (described below).
- < >: buttons to move the number of orders left (older) and right (more recent).
i) Filters

- Symbol: all symbols can be displayed or you can filter by a specific symbol. Only those symbols in which the DARWIN and the investors have previously traded can be selected.
- Execution time: a minimum and maximum range can be filtered.
- Divergence ‰: a minimum and maximum range can be filtered.
- Reset: eliminates all filters.
ii) Time evolution of the divergence and the invested capital
![]()
Displays a graph that shows the time evolution of:
- Divergence as a %: time evolution of the divergence that the DARWIN has accumulated from inception, showing values for every day from the day it started to have investment. Positive divergence means better price, while negative divergence means the worse price for investors.
- Invested capital: the evolution over time of the total capital invested by all investors (not including losses and earnings); the same information that is displayed on the DARWIN details page.
This graph also shows a shaded vertical stripe that indicates the time range of the orders viewed in the list below.
Interaction with the graph
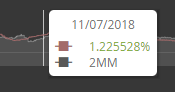
Left-clicking on this graph selects the date, and the order table below shows all the orders (that meet the filter conditions selected in the filter bar) up to that date.
E.g. if we select the date as in the image below, the order list will display all the orders up to 11/07/2018.
b) CSV Download
A CSV file providing order information can also be downloaded from the order navigation bar.

There are 2 options.
- With the current filter: it instantly downloads a CSV file with the data being viewed (only the selected number of orders will be downloaded).
- By date range: it downloads all the existing orders between 2 dates, with no order number limit but limited to a maximum time range of 12 months. It also makes it possible to filter by a specific symbol. If the number of orders selected for downloading is high, the download can take between 60 and 120 seconds to be completed.
c) Order graphs
These graphs display the main information on the divergence associated with the orders filtered in accordance with the order filter bar.
The X-axis for the graphs is not time, but only the order of the order sequence. That is, all the bars/points in the graphs are equally spaced horizontally, and there can be a time difference of milliseconds, minutes, or days between orders. The most recent orders are displayed on the right of the graph. At the bottom of the graph, the date of the first and the last displayed order is shown (time range that comprises all displayed orders).

There are 4 different graphs.
- Divergence ‰: bar graph displaying the divergence ‰ associated with each order. The positive divergence (favourable for investors) is shown in green and the negative divergence (unfavourable for investors) is shown in red. The maximum and minimum divergence of all the orders being viewed are displayed as horizontal lines.
- Execution time: a white line graph that indicates, for each order, the time that has elapsed from the reception of the strategy order to the market execution of the investors’ order.
- Leverage: orange line graph that shows the investor leverage for each order, i.e. nominal divided by the total investor equity.
- Nominal volume: the nominal value, in the underlying strategy currency, of the investor order executed.
To the right of the graphs, there is a panel that displays information associated with the order. Moving the cursor over each order updates this information.

The fields shown are the following.
- Line 1: trading platform ticket number | date of the underlying strategy order.
- Line 2: symbol | type | price for the strategy
- Line 3: divergence in pips | divergence as ‰ | price for investors
- Line 4: execution time
- Line 5: investor equity
- Line 6: leverage
- Line 7: total volume executed for all investors | nominal for the entire order in the strategy currency.
See the Order list section to obtain more information about each of the fields associated with the strategy orders and investors' orders.
Interaction with the graphs
Clicking on an order displays its details/breakdown in the order list. In addition, the relevant order will be selected (highlighted in blue) and the data in the information panel on the right will be fixed until another order is selected, or else it is de-selected in the order list, clicking on the relevant row.
You can also zoom on the graph area by left-clicking, dragging, and releasing the cursor.
The leverage and nominal graphs are not displayed by default and can be activated and de-activated as preferred.

d) Order list
The order list displays all the information on the divergence associated with the orders filtered in accordance with the order filter bar.
The information about the order executed by the strategy is shown on the left, and the information about the global order executed for all investors is shown on the right.

Description of the fields:
- Strategy
- Order: trading platform ticket number associated with the order. 1 or 2 orders can be associated with the same ticket; there will be one single order if the trade has not been yet closed, or if hedging was carried out on opening or closure. For now, no ticket number is displayed for MT5 accounts.
- Date: date and time of execution of the order.
- Symbol: symbol of the order.
- Type: buy or sell.
- Size: volume in lots.
- Price: price of the strategy order.
- Investors
- Execution time: the time that has elapsed from the execution of the strategy order to the completion of the execution of the investors’ order.
- Equity: total valuation (including losses and earnings) of all the investors’ aggregate investment in the underlying strategy currency at the time of execution of the order.
- Size: volume in lots.
- Nominal: total nominal value of the order in the strategy currency.
- Price: price of the investors’ order.
- Divergence: variation in pips (FX) or in points (other assets) between the strategy price and the investors’ order price.
- Divergence ‰: variation in ‰ between the strategy price and the investors’ order price E.g. if the strategy price is 1.15384 and the investors’ price is 1.15389 the divergence ‰ will equal (1.15389 - 1.15384) / 1.15384 * 1000 = 0.00433‰, multiplied by -1 if it is a buy order.
- Divergence €: the divergence as a monetary value, in the strategy currency. It is calculated by multiplying the nominal value of the order by the divergence percentage.
Interaction with the order list
The order list can be arranged by field clicking on the order arrows (![]() ) or the headers of each column that can be arranged. Only the results yielded in terms of the criteria selected in the filter bar are arranged; i.e. not all the existing orders are arranged, but only the orders viewed. Only the list is arranged, not the graph.
) or the headers of each column that can be arranged. Only the results yielded in terms of the criteria selected in the filter bar are arranged; i.e. not all the existing orders are arranged, but only the orders viewed. Only the list is arranged, not the graph.
Clicking on a row or on the see details icon (![]() ) shows/hides the details of the market execution of an investors’ order. These details are also displayed by clicking on a point/bar in the order graph.
) shows/hides the details of the market execution of an investors’ order. These details are also displayed by clicking on a point/bar in the order graph.
Moving the mouse cursor over the rows of the table, the corresponding order will be displayed on the graph above. This is useful when the rows are not ordered chronologically.

i) Details of the execution of an investors’ order
An investors’ order is divided into one or several deals.
A deal is one of the segments in an investors’ order for which Darwinex requests execution from the liquidity provider. The details of the execution of an investors’ order displays the various deals that have been part of it.
In turn, each of the deals can be divided into one or several fills. A fill is each of the fragments into which the liquidity provider fills in a deal.
E.g.: a 50 buy order (deal) is sent and then filled in by smaller fragments (fills) at various prices; i.e. 10 at 1.25, 15 at 1.27, and 25 at 1.265. The deal price will be the weighted average of fill prices.
It is not necessary for all the fills of the previous deal to have been completed in order to send new order deals. A fill from a later deal could be executed before a fill from a previous deal.
The following information for each deal and fill is displayed.

- Date: the date when the execution of a deal or fill was completed. The deal date will be the date of the last fill.
- Volume: volume in lots. The deal volume will be the sum of the fill volumes.
- Market time: the time from the sending of the order to the market to the completion of its execution.
- The market time for the complete order is the longest market time of all the deals.
- The market time for a deal is the longest market time of all the fills in that deal.
- The market time for a fill is simply the time between the request for the execution of the deal and the completion of that fill.
- Execution time: the time that has elapsed from the reception of the strategy order to the completion of the execution of the investors’ order. The market time is included in the execution time. The difference between execution time and market time is the time of processing in the Darwinex system.
- Price: the price for each deal and fill. The price of the deal and the complete order may have more decimals than standard as the weighted average price is calculated on the basis of all the fills.
- Divergence: variation in pips (FX) or in points (other assets) between the strategy price and the investors’ order price.
- Div. VWApip: variation in pips weighted by the volume. This value specifies the total contribution of each fill/deal in the total divergence of the global investors’ order. The total Div. VWApip for all the deals corresponds to the divergence of the complete order; and the total Div. VWApip of all the fills in a deal corresponds to the divergence of the relevant deal. E.g.:
- An order with a total volume of 58.33 lots, and a strategy order price of 1.58747, divergence, 8.43 pips
- Deal 1: volume 50 lots, price 1.5881882 → Div.VWApip = (1.5881882 - 1.58747)*50/58.33 = 6.15635 pips
- Fill 1: volume 3.25 lots, price 1.5877200 → Div.VWApip = (1.58772 - 1.58747)*3.25/58.33 = 0.13929 pips
- Deal 2: volume 8.33 lots, price 1.5890642 → Div.VWApip = (1.5890642 - 1.58747)*8.33/58.33 = 2.27664 pips
The ⋀ and ⋁ icons hide/display the information about fill execution.
The graph in the left-hand panel displays the fills, with the X-axis being the sequence of execution of the fills.
- The upper graph shows the VWApip divergence, in red if negative and in green if positive. The number next to each bar specifies the deal to which each fill belongs.
- The bottom graph shows the market time for each fill.
- To the right of the graph, and information panel indicates:
- Deal and date of execution of the deal.
- Fill and date of execution of the fill
- VWap divergence
- Market time
- Execution time
ii) Order pooling
Sometimes, when the strategy trades the same assets several times in a short timeframe, the risk manager can pool these orders together into a single order for the investors.
When this happens, there will be investor data for only one of the orders. Investors' volume associated with the order will have an increased size as it's associated with more than one of the strategy's orders.
In the following example, 24.98 lots are two times 12.49 lots as two of the strategy's orders, each of 0.4 lots, got pooled together into the first order for investors.

3. Net strategy and investors' positions
This section shows the net positions of the underlying strategy and of all the investors in the DARWIN. Their symbol, total open volume, type/side (buy or sell) and price (VWAP: Volume-Weighted Average Price) is shown for all of them. It's important to emphasize that while the FIFO rule applies to both investors and the DARWIN, the operation of the underlying strategy will depend on the trader.
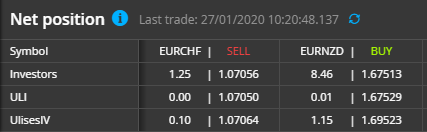
The date and time of the last update are shown next to the section title.
By clicking on the icon, all positions will be updated.
The investors' and the DARWIN's volume is rounded to 2 decimals. All the decimals are displayed by moving the cursor over it.
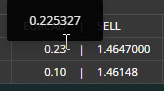
It's usual that the DARWIN's positions are smaller than the minimum contract size and that therefore "0.00" is displayed as the size. The details are displayed by moving the cursor over it.
a) Alerts
If an inconsistency between the underlying strategy positions and the investors’ positions is detected, the text of the problematic symbol is highlighted in red. E.g. the investors should never have an open position in an asset while the underlying strategy does not, and vice versa.

b) VWAP (Volume-Weighted Average Price) calculation
The VWAP price is calculated by finding the weighted average for all the trades in the same asset in the case of the underlying strategy and the DARWIN, and for the same asset and all the investors in the case of investors.
All the investors’ price is considered when calculating the investors’ VWAP, which means that the trades of investors who bought the DARWIN after the date when the strategy / DARWIN traded in an asset are also counted.
E.g. the DARWIN can trade on 4 January at 16:00 buying EURUSD, at a price of 1.11401, and on 8 January at 17:00, a new investor can buy the DARWIN, thus executing trades for the EURUSD, let us say at a price of 1.11701. There is a price difference between 1.11401 and 1.11701, but this difference is not the divergence of normal order execution.
Thus, the difference between investors’ and strategy VWAP value should never be understood as a divergence.
Here are two examples of how the VWAP is calculated.
| Sequence | Side | Volume | Price | Net volume | VWAP |
| 1 | BUY | 1 | 2 | 1 | 2 |
| 2 | SELL | 1.5 | 1 | 2.5 | 1.4 |
| 3 | BUY | 1.5 | 1.35 | 1 | 1.4 |
| 4 | BUY | 1 | 2 | 2 | 1.7 |
| Sequence | Side | Volume | Price | Net volume | VWAP |
| 1 | BUY | 1 | 2 | 1 | 2 |
| 2 | SELL | 1.5 | 1 | 2.5 | 1.4 |
| 3 | BUY | 1.5 | 1.35 | 1 | 1.4 |
| 4 | BUY | 1 | 2 | 2 | 1.7 |
| 5 | SELL | 3 | 1.45 | -1 | 1.45 |
| 6 | BUY | 0.5 | 1.33 | -0.5 | 1.45 |
| 7 | SELL | 1.3 | 1.63 | -1.8 | -1.58 |