What does the Experience (Ex) attribute tell us about a trading strategy / DARWIN?
The Experience (Ex) Investable Attribute reflects the statistical representativeness of the information pertaining to a DARWIN or trading strategy.
What is it?

The Experience (Ex) Investable Attribute measures the statistical representativeness of the information pertaining to a DARWIN/trading strategy.
Analyzing only a few operations of a trading strategy could lead to incorrect conclusions being drawn - it is not the same thing to analyze 100 trades as to analyze 100,000 trades.
By using a larger data set the statistical representativeness of the data is improved up to a certain point.
This allows more confidence in the conclusions that we reach from our analysis relating to the data and statistics that you can see in the profile of a DARWIN / strategy.
However, comparing data from diverse types of trading strategies such as scalping, day trading, swing trading, position trading, etc. forces us to consider a way of analysing this new concept of experience/statistical importance.
Without further ado, we have the pleasure to present you the Experience (Ex) Investable Attribute.
How is Experience (Ex) calculated?
Comparably measuring the Experience (Ex) of such different strategies like scalping, day trading, swing trading, position trading, etc - where the number of operations varies greatly - means it is imperative to take into account the D-Period.
In short, the longer a trading strategy has been in operation - as measured by D-Periods - the greater the Experience (Ex) score will be.
For a trading strategy to obtain a maximum score of 10 out of 10 on the Ex attribute, it must have a minimum of 12 D-Periods.
Where can I see the accumulated D-Periods?
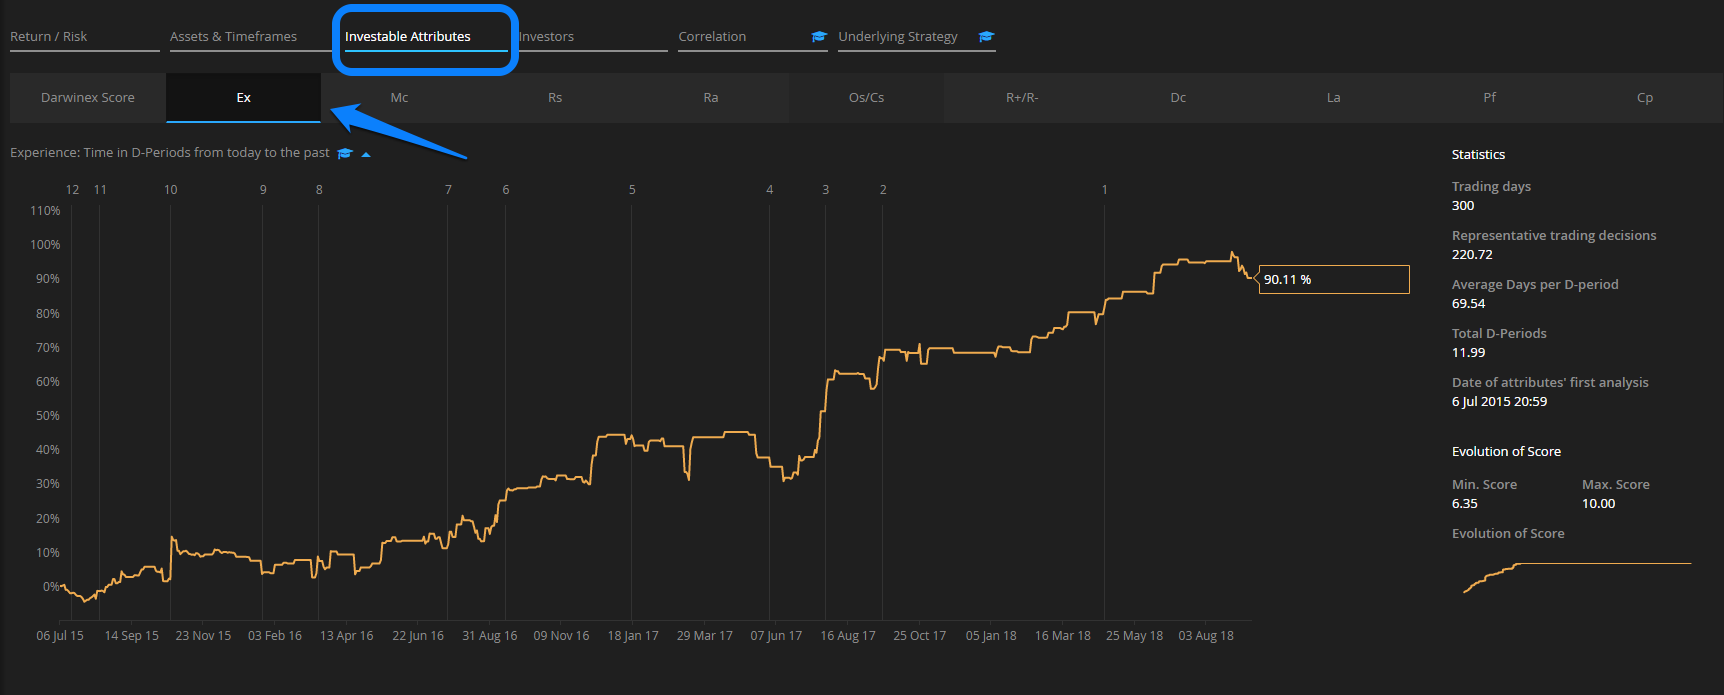
The Experience graph, showing the return for a maximum of 12 D-Periods, can be found by selecting "Ex" on the menu bar in the Investable Attributes tab.
This graph is divided into 12 parts by 12 vertical lines with each part equivalent to 1 D-Period.
As you will observe, the space between the different lines is not uniform.
This is due to the fact that depending on the trades executed within a strategy, there will be occasions when a D-Period is completed within 15 trading days while on other occasions it may require substantially more.
Where it requires more, this may be as a result of either decreasing the frequency of trades or modifying the duration/leverage of his positions.

The accumulation of D-Periods requires a separate explanation which you can read in our article: What is a D-Period?
Experience (Ex) level examples
To consolidate the theory behind this Investable Attribute, we will analyze two DARWINs with different Experience (Ex).
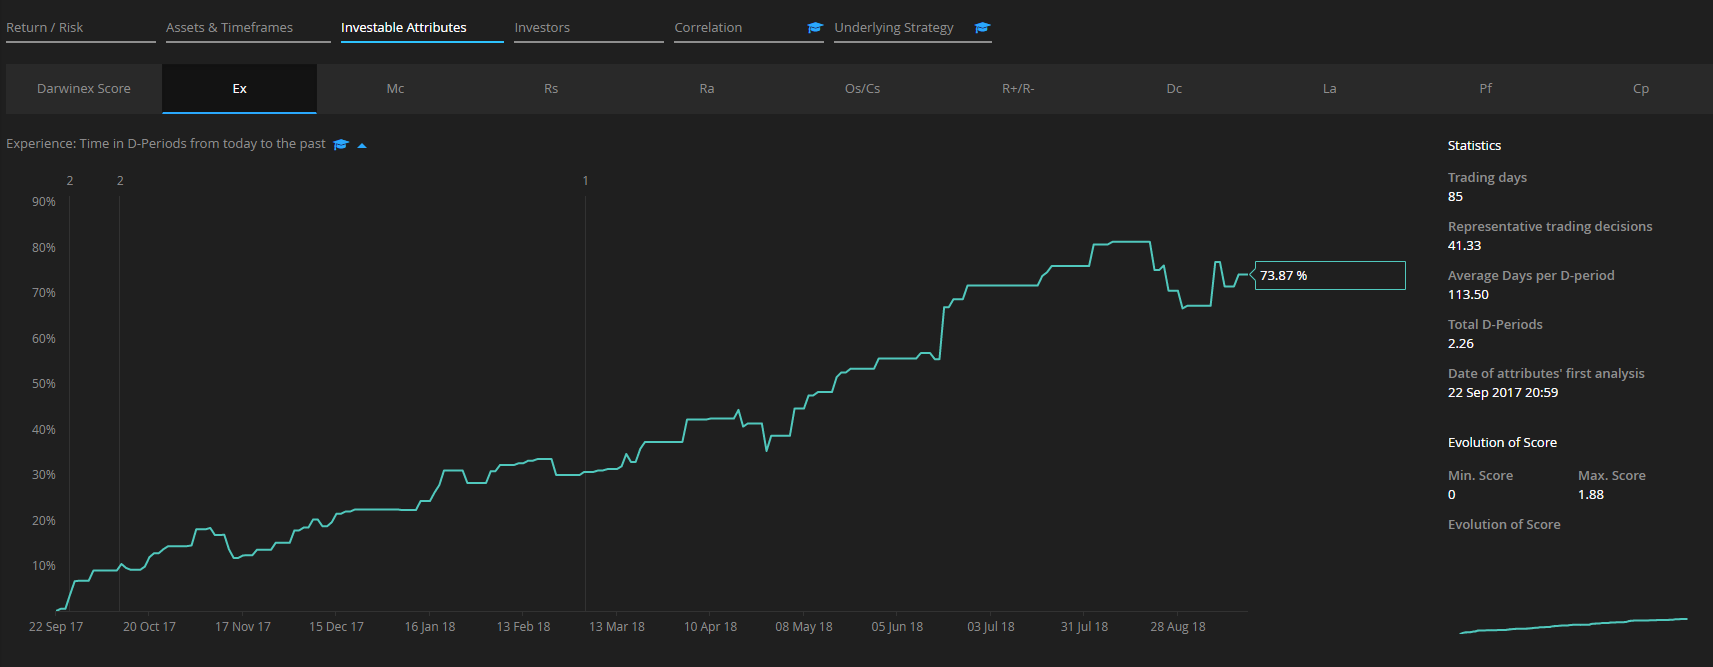
- Low Experience
In this example, you can see a DARWIN that has a more than reasonable 18.8% return in under 2 months.
However, on the right-hand side you can see that it has accumulated just 1.47 D-Periods and has an Ex score of only 1.22.
With such little information, it is impossible to draw reliable conclusions about the quality of the DARWIN.
In this scenario, we recommend including this DARWIN in your favorites list, so it can be more thoroughly analyzed at a later date when the Experience (Ex) score is higher and thus the underlying information is more statistically representative, allowing more solid conclusions to be drawn.

- High Experience
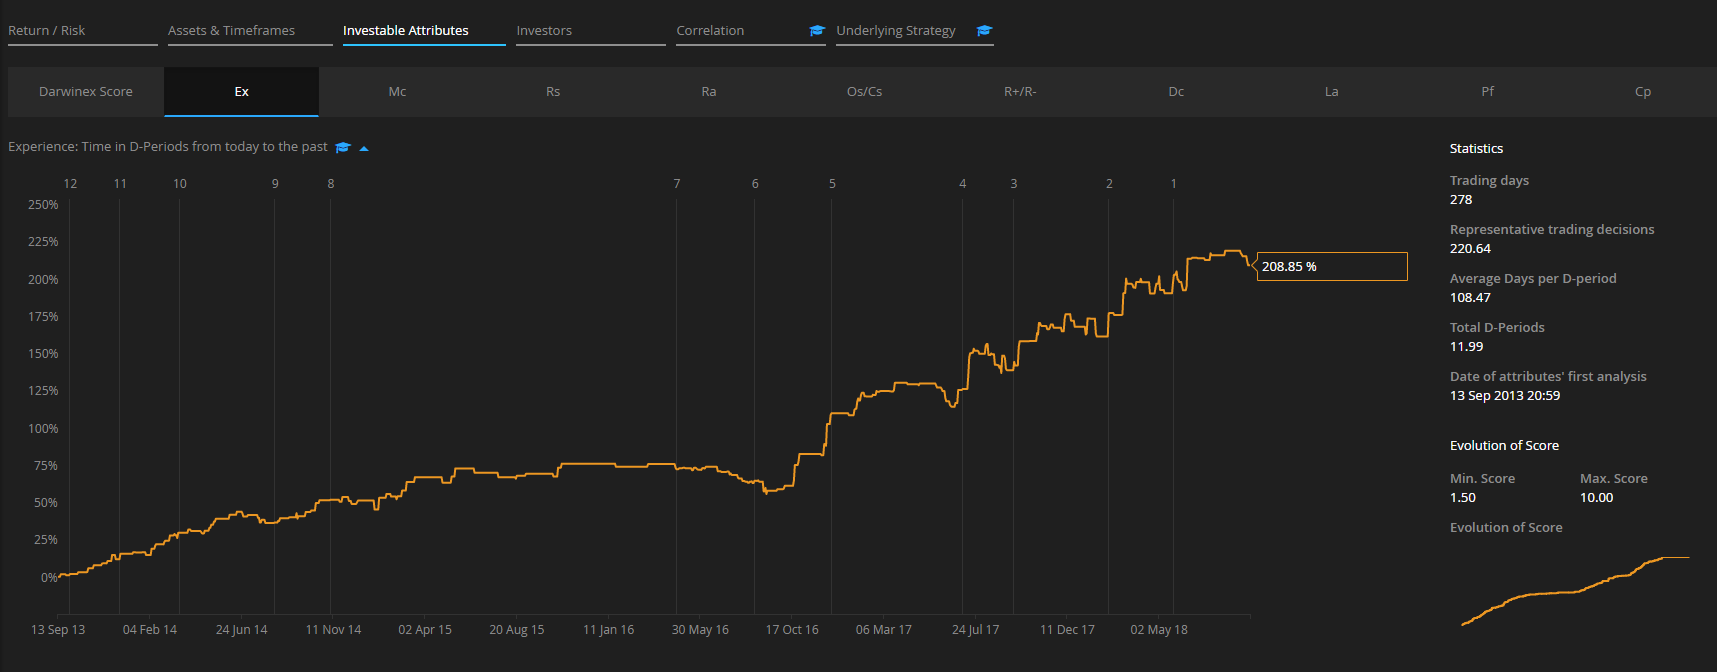
In this example, we highlight a DARWIN which has reached the maximum Experience (Ex) score of 10.
In this graph, you can see the return during the last 12 D-Periods, but if you were to go to the return graph you'll be able to see that the trading history actually goes back to 2013.

A much longer track record means that the conclusions that can be drawn from an analysis of the trading strategy are much more reliable than in the previous example.
Tips
Below we provide some tips in relation to the Experience (Ex) Investable Attribute:
1. Its score can only increase
Of the 12 Investable Attributes, Experience (Ex) is the only one that cannot decrease.
2. Personal filters
Experience (Ex) can be used in conjunction with more than 20 other criteria to develop your own custom filters.
3. 1 D-Period = 1 Standardized Month
Think of a D-Period as being equivalent to 1 standardized trading month where positions are opened daily in uncorrelated assets and with a largely consistent level of leverage