The better the score, the more likely it is that the DARWIN can sustain substantial levels of investment without suffering divergence that negatively impacts investors.
The Cp score is measured from 0 to 10 and takes into account the last 12 D-Periods of Experience (Ex), with a heavier weighting applied to more recent periods.
The score can go up and down and is only calculated once a DARWIN has been created.
Generally speaking, it can be said that strategies with longer average trade durations and wider Take Profit and Stop Losses, will have a greater Capacity (Cp).
The longer the trades and the lower the average leverage per trade on the same asset (which is achieved by splitting the operation into intervals of no less than 10 seconds), the better the capacity.
Where can I see the information?
As with the rest of the Investable Attributes, you can access Cp information for a DARWIN via the icons in the top right of the DARWIN profile,
or by clicking on the "Investable Attributes" → "Cp" tab with the DARWIN profile.
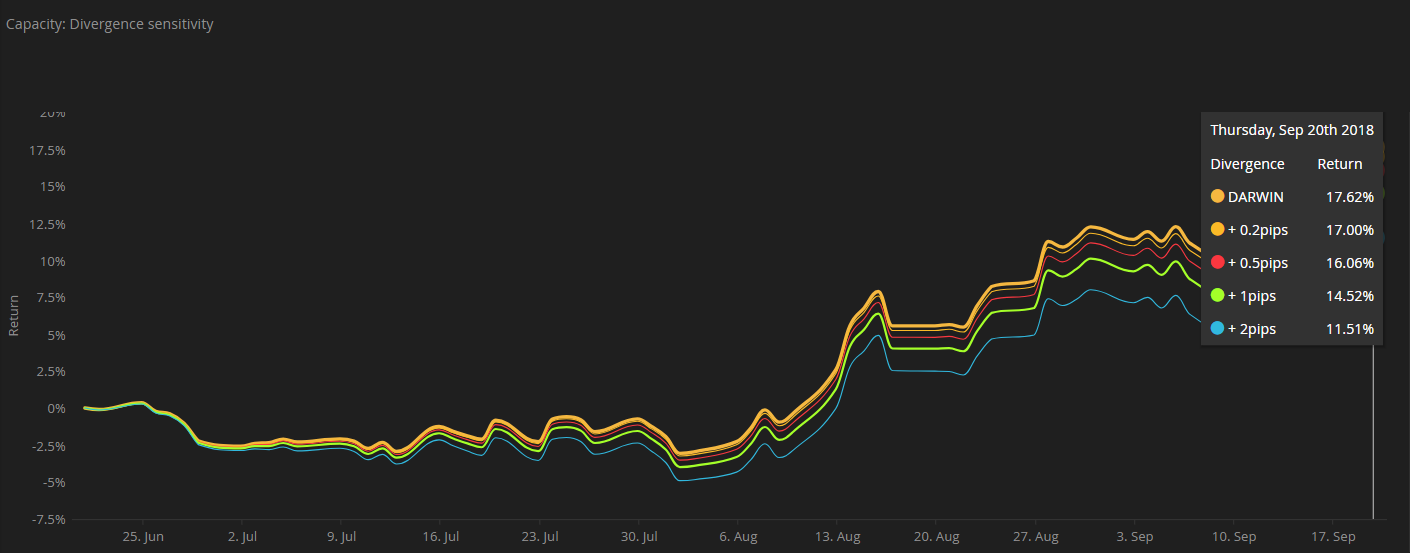
Sensitivity to divergence
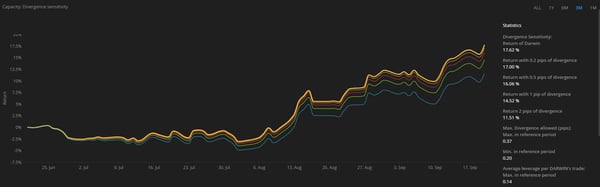
The sensitivity to divergence graph compares the return of a DARWIN with the return that would have been obtained in hypothetical situations where the DARWIN suffered slippage from 0.2 to 2 pips per trade.
This difference in return is what we call investor divergence, a situation ordinarily caused by the volume of capital invested in a DARWIN which in turn means larger market orders which can exhaust liquidity.
In addition to the Sensitivity to Divergence graph, there are a further three graphs within the Cp tab.
Maximum allowed divergence (in pips)
This graph shows the maximum slippage in pips beyond which divergence exceeds 0.5% on a monthly basis.
Average leverage per trade (DARWIN)
This chart details the average leverage per trade for the DARWIN.
The lower the leverage, the smaller the volume sent to market and the lower the impact of divergence will be for investors.
Maximum estimated investment (DARWIN)
This chart represents the estimated maximum AuM for a DARWIN without exceeding the threshold of 0.5% monthly divergence.
Examples of Capacity (Cp) scores
Let's take a look at some examples of a good, average, and poor Cp score and explore the reasons behind them.
- Good score
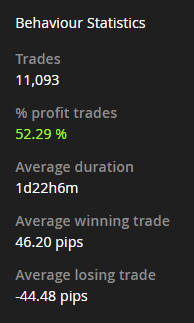
This DARWIN has a Capacity (Cp) score of 8.7 where return would hardly be impacted by slippage to the extent that it is estimated that it can absorb 107mn in AUM.
This is the result of the underlying trading strategy leaving the trades open on average almost 2 days.
Additionally, the trader's average winning trade makes 46 pips while his average losing trade loses 44 pips, indicative of fairly wide Take Profit and Stop Losses.
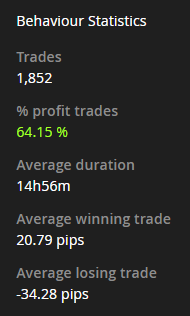
- Average score
This DARWIN has a Cp score of 5.1 which equates to being able to absorb 5mn in AuM without suffering excess divergence.
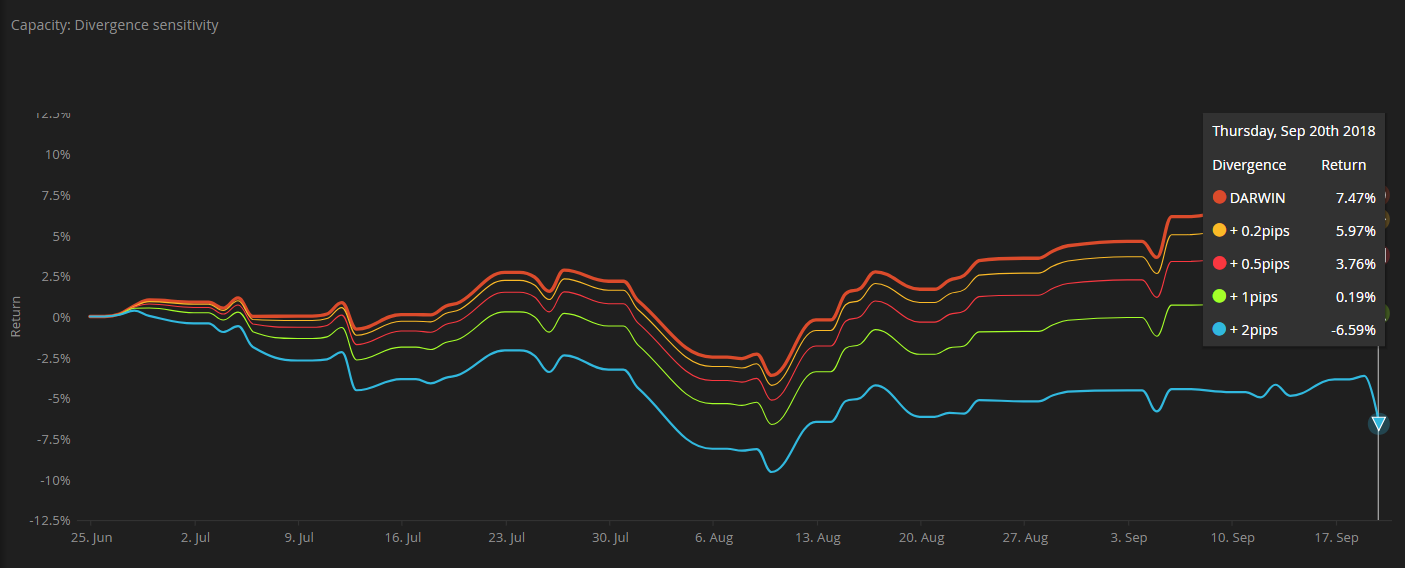
The average trade duration is around 6 hours while the average winning trade makes about 21 pips and the average losing trade -34 pips.
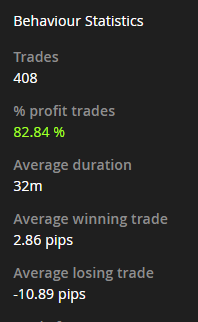
- Poor score
And finally a DARWIN with a very low Cp score of just 0.2 meaning it can barely absorb any AuM - just 140K in fact.
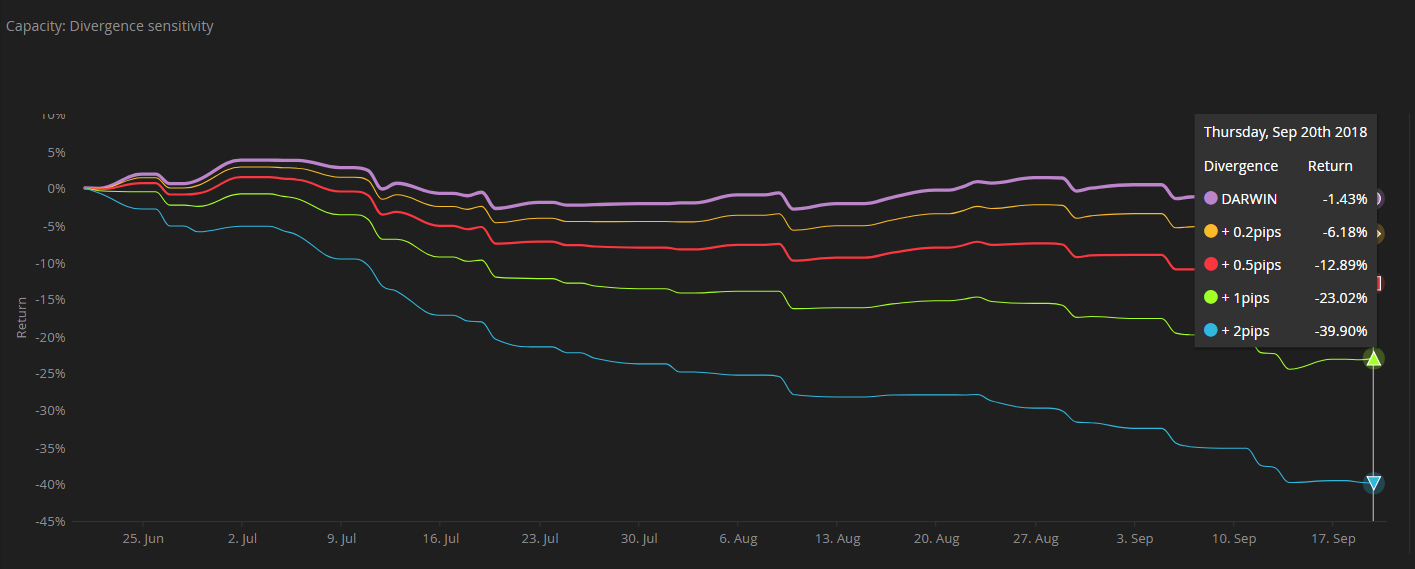
Why?
An average trade duration of just 32 minutes, an average winning trade of less than 3 pips, and an average losing trade of 11 pips.
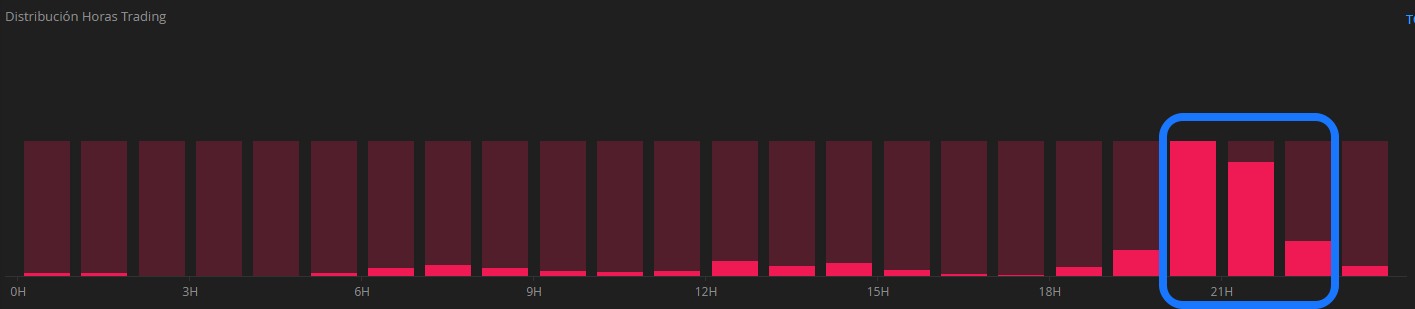
Additionally, we can see that this DARWIN usually operates during periods of low liquidity where spreads widen ( 20:00 y 23:00 GMT)
Tips
- Market liquidity is not infinite. If a DARWIN starts to accumulate substantial investor capital, the prices at which it executes trades in the market can be negatively affected due to a lack of liquidity meaning that investor orders can be filled away from Top-of-Book, leading to divergence.
- Capacity for investors. It is of vital importance that you take note of a DARWINs Cp score so that you are cognizant of how returns might be impacted as investor capital grows. Divergence affects all investors - and not just the most recent investors - as all DARWIN investors get the same execution.
- Capacity for traders. Capacity is what will determine the maximum AUM you can expect to manage with your strategy. It therefore directly impacts your earning potential as you earn a 15% performance fee on profits generated for investors.
- DARWIN with toxic flow. If a DARWIN is very toxic, we can assure that it won't be able to manage more volume than estimated by the Capacity Attribute. These DARWINs can cause problems of divergence even with low investment volume. Low meaning lower than the largest volume defined by the Capacity attribute. A DARWIN being toxic without having much volume can be an indicator that the provider is selling its signal elsewhere, or that it's an EA. Hence, we may not be seeing all the volume that the DARWIN is actually handling.
- DARWIN with high divergence but no toxic flow. A DARWIN with a high divergence but no toxic flow is suffering from divergence for a specific reason. This reason is not properly fractionating its operation. By doing this, the market would most likely be able to absorb more volume. The trader needs to introduce the volume gradually into the market (at least 10 seconds of difference).
Want to know more?
If you want to learn more about the Cp attribute, we recommend listening to the "Introduction to the Investable Attributes webinar". Juan Colón talks about Cp from minute 22:50
And this video might help you to learn more about flow toxicity.