Investing in DARWINs is not available for Darwinex Global (FSA regulated) clients.
The main purpose of the DARWIN Investment Platform is to help you invest in DARWINs as simply and intuitively possible.
However, we understand that there are concepts that you may not be 100% familiar with, so we hope this article will shed light on all of them.
Content
- How to get access to your DARWIN Investment Platform
- Demo or Live account
- DARWIN Investment Platform top menu
- DARWIN Investment Platform sections (left-hand side menu)
How to get access to your DARWIN Investment Platform
To launch the DARWIN Investment Platform you have to click on the "Investment" tab that you may find in the top menu of our website.

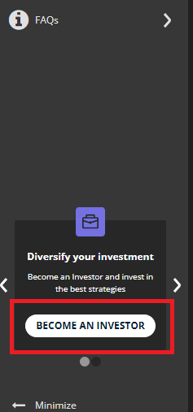
* If you have opened your account as a trader, remember that to enable the investment terminal, you can do so by clicking on the "become an investor" option in the left side bar:
Demo or Live account
The next thing you have to do is select between your demo or live investment account as shown below:
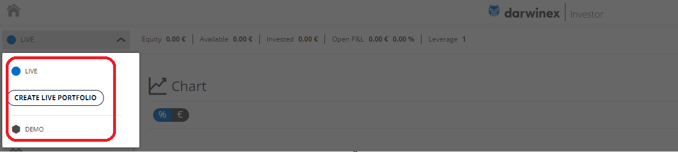
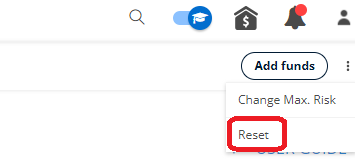
Remember that you can open several live portfolios but only one demo, which you can reset as many times as you want by clicking on the dented wheel located in the upper right.
DARWIN Investment Platform top menu
The DARWINs Investment Platform offers you relevant information in its top menu.
Besides, it will always be visible regardless of the section you are consulting in the left side menu.
The top menu is made up of the following sections:
![]()
-
Equity
Equity = Invested + Open P&L + Available
-
Available
Capital available to invest in DARWINs.
If the available amount is negative* it may be due to the daily collection of management fees, as well as the quarterly performance fees that Darwinex would have had to advance to the DARWIN provider due to insufficient capital in your "available" section.".
Said debt with Darwinex will be settled when, either you deposit funds in your DARWINs Investment Platform or you proceed to the sale of any DARWIN in your current portfolio, releasing capital with it.
* No additional cost or charge will be applied to have a negative balance in the available section.
-
Leverage
By default, all investors invest in DARWINs with no leverage (X1).
However, Darwinex offers the option to activate investor leverage to give you the option to multiply up to X4* the capital available to invest.
From the activation of investor leverage, the upper menu will incorporate a new section called "available to invest" which would be equivalent to multiplying the amount of the "available" section by X4 (if the amount is positive).
The leverage will not affect investments already made in DARWINs and will only influence purchases from its activation.
*leverage may oscilate from 1 to 4 depending on the information given on the suitability and appropriateness test filled in the registration process
-
Invested
Total capital invested in DARWINs without taking into account the open P&L.
-
Currency impact
Accumulated difference between DARWIN's return and your results as an investor. This value is included in the % open P&L.
-
Open P&L
Current open profit/loss of your DARWINs portfolio.
DARWIN Investment Platform sections (left-hand side menu)
The DARWINs Investment Platform is divided into different subsections that you may check in the left side menu.
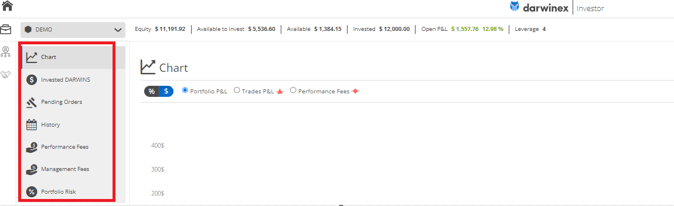
These subsections are:
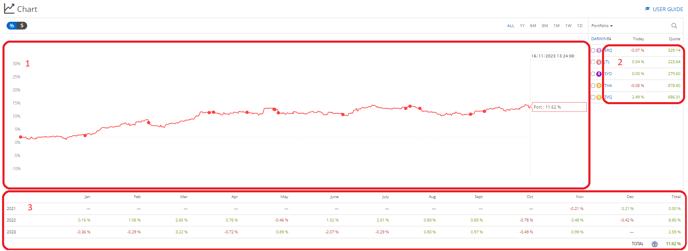
Chart
The chart section is made up of the following subsections:
- Chart with the evolution of your investment in DARWINs (in percentage or monetary value).
- Table showing the DARWINs in which you are currently invested.
- Monthly, annual, and total returns of your DARWINs portfolio.
Click HERE to find out how we calculate returns.
Also, in the chart section, you can activate investor leverage.
Invested DARWINs
The inverted DARWINs section is made up of the following subsections:
- DARWINs
Indicates the DARWIN ticker (3 letters that identify it).
Also, if you click on the icon on the left, you will be able to see a summary of the current status of your investment.
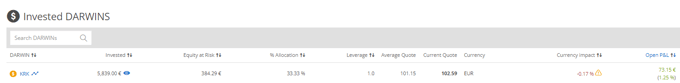
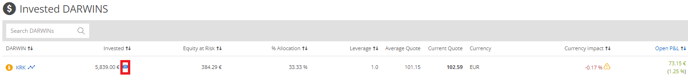
- Invested
It shows the capital invested in the DARWIN without counting the open P&L.
Likewise, by clicking on the DARWIN eye you will have access to relevant information about your investment in such DARWIN.
- Equity at Risk
Reflects 6.5% (DARWIN target monthly VaR) of equity (invested capital + open P&L) invested in the DARWIN.
- % Allocation
% Allocation ⇒ (invested capital in a DARWIN * 100) / total amount invested in the portfolio
- Leverage
It ranges between 1 (default leverage that we offer to our investors) and 4 (maximum leverage with which you can invest if you activate the leverage of your portfolio in the "Chart" section).
- Average Quote
It reflects the weighted average of the quote prices of all the investments made in the DARWIN.
Remember that you can check all your investments in one DARWIN, as well as their market value, in the DARWIN eye.
- Current Quote
Displays the current quote value of the DARWIN.
- Currency
Indicates the currency in which the DARWIN is listed in the DARWIN Exchange: €, £ or $.
Remember that one of the random reasons for investor divergence is the difference between the base currency of your wallet and the base currency of the DARWIN in which you invest.
- Open P&L
Shows the unrealized/realized profit/loss of your investment in the DARWIN.
-
Actions
You can buy/reinvest in DARWINs (TRADE button) or sell totally and partially a DARWIN ("X" icon button).
- TP/SL
In case you have not placed a Stop Loss (SL) or Take Profit (TP) order during the DARWIN purchase, you can do it directly from this section.
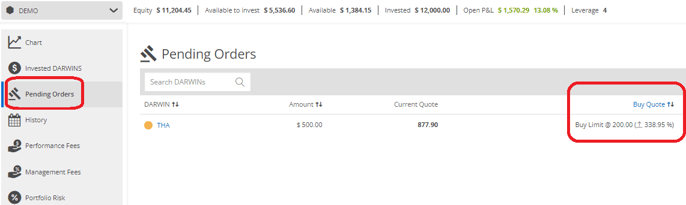
Pending Orders
Shows all pending "Buy Limit" and "Buy Stop" orders that are waiting to be executed.
History
This section is updated whenever you proceed to sell, totally or partially, any of your DARWINs.
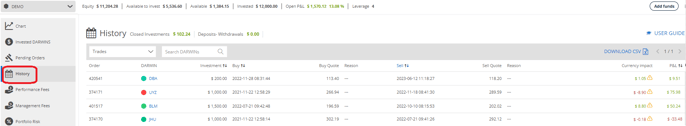
The final profit/loss amount (P&L) already takes into account the investor divergence.
That said, it is important that you know that in the case of obtaining benefits that exceed the high-water mark in said DARWIN, 20% of them -performance fees-, will be retained pending the end of the quarter.
Remember that we will apply the FIFO criterion in cases of partial sales of DARWINs (First in, First out).
You can check the status of all performance fees in the next section that we explain below.
Performance Fee
In this section you can consult the following:
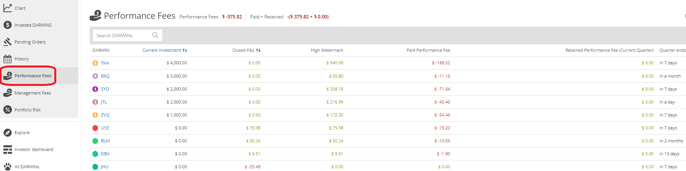
- Current Investment
- Closed P&L
Shows realized profit/loss on past DARWINs sales.
- High-Water Mark
You may read more about the high-water mark concept HERE.
- Paid Performance Fee
It reflects 20% of your current high-water mark.
You may read more about performance fees HERE.
- Retained Performance Fee (Current Quarter)
Reflects 20% of the profit from sales made in the current quarter.
At the end of the quarter, Darwinex will evaluate your equity (invested + P&L) to confirm if your net profit from your first investment in a DARWIN has exceeded the current high-water mark.
If not, we will proceed to return the retained capital.
- Quarter Ends
Indicates the time remaining for the end of the quarter where Darwinex will proceed to assess whether the net profit since the inception has exceeded your current high-water mark.
Management Fees
In the "Management Fees" section you can get access to the following data:
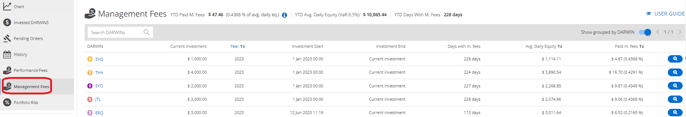
You may read more about management fees HERE.
- Current Investment
- Year
Show the year since your first investment in a DARWIN.
- Investment Start
Indicates the exact date of your first investment in the DARWIN and the one that will be taken into account to calculate the quarterly periods to pay performance fees, in case you generate profits.
- Investment End
It reflects the date you stopped being invested in the DARWIN.
- Days with m.fees
Indicates the days on which a management fee has been charged for being invested in the DARWIN.
- Avg. Daily Equity
Shows the average daily equity invested in the DARWIN.
Weekends and holidays when the DARWIN is not listed are not taken into account for such calculation.
- Paid m.fees
It reflects the commissions paid since inception and their percentage regarding the average capital per day.
- A magnifying glass with the commission breakdown paid day by day
You may read more about management fees HERE.
Portfolio Risk
The "Portfolio Risk" section shows a correlation matrix of all the DARWINs that make up your current investment portfolio.
Besides, we show the following data:

- Monthly VaR
It shows the same data as the Equity at Risk in the top menu.
- Current Equity at Risk vs Max. Risk
Compares the "Current Equity at Risk vs Max. Risk" with the maximum risk level of the portfolio selected by the investor.
Equity at Risk = (Invested DARWIN 1 + Open P&L DARWIN 1) * VaR DARWIN 1 + (Invested DARWIN 2 + Open P&L DARWIN 2) * VaR DARWIN 2 ... * (1 - Diversification Benefit*)
* Diversification Benefit can be found in the section Portfolio Risk (left-hand side menu)
You can adjust the maximum risk level, which is subject to the limits set based on the personal and financial information you provided during the registration process, meaning that exceeding these limits will not be permitted:
Please note that Darwinex will not sell your DARWINs if the current risk level of your portfolio exceeds the maximum risk level.
However, if the portfolio risk level exceeds the maximum risk level when making a new purchase in a DARWIN, the system will not allow such purchase.
- Diversification Benefit
In percentage value, it shows the benefit of a diversified portfolio taking into account the level of correlation among the DARWINs that compose it.
For example, if the correlation level between two assets were 1, the diversification benefit would be 0%, whereas if the correlation were 0.5, the benefit would be 50%, and so on.
- Current monthly VaR in monetary value
- DARWIN target VaR ⇒ 0.065