What does the Performance (Pf) Attribute tell about a trading strategy / DARWIN?
The Performance (Pf) Investable Attribute compares the risk-adjusted return of a DARWIN (maximum 6.5% monthly VaR) against the returns of 10,000 random strategies with exactly the same level of risk.
What is it?
The Performance (Pf) Investable Attribute compares the risk-adjusted return of a DARWIN (maximum monthly 6.5% VaR) against the returns of 10,000 random strategies with exactly the same level of risk and ranks them on a percentile basis from 1% to 99%.
The spirit is similar to Sharpe/Sortino ratios, but the implementation overcomes shortcomings that arguably render Sharpe/Sortino unfit to assess high-risk, high rotation trading strategies.
Pf is an excellent way to identify the statistical illusions inherent in many trading strategies offered on copy trading platforms. We refer to those strategies with a long track record, a significant number of trades, and an apparently seductive equity curve that at first glance appear investable.
However, whereupon further examination on a trade by trade level, it can be seen that the positive returns are predominantly generated by a small number of excessively leveraged trades, meaning that the return is not a consequence of a robust and stable strategy that generates consistent alpha.
The Pf score fluctuates from 0-10 and is based on the last 12 D-Periods of Experience (Ex).
Where can I see this information??
As with the rest of the Investable Attributes, you can access the Pf information for a DARWIN via the icons in the top right of the DARWIN profile

or by clicking through the ["Investable Attributes" / "Pf"] tab within the DARWIN profile.

Examples of Pf scores
- Good score
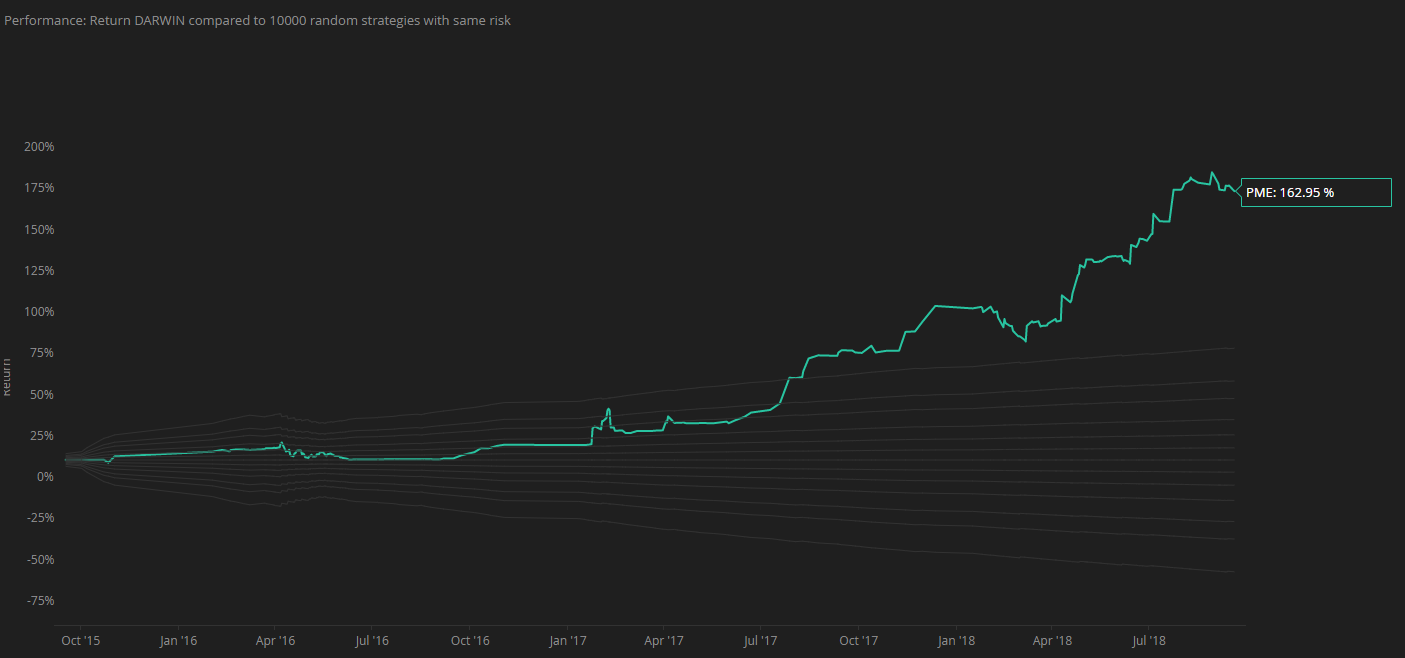
This DARWIN has an excellent 9.9 score for Pf across the last 12 D-Periods - pretty much top of the class.

- Average score
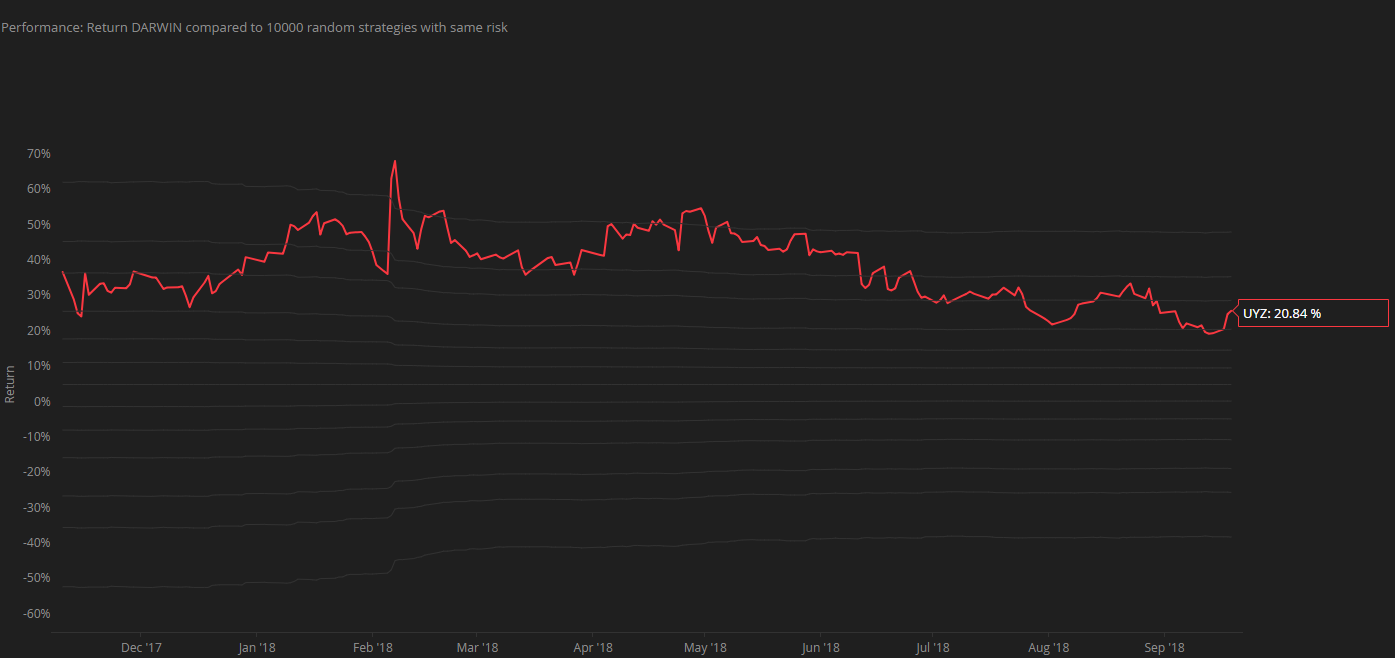
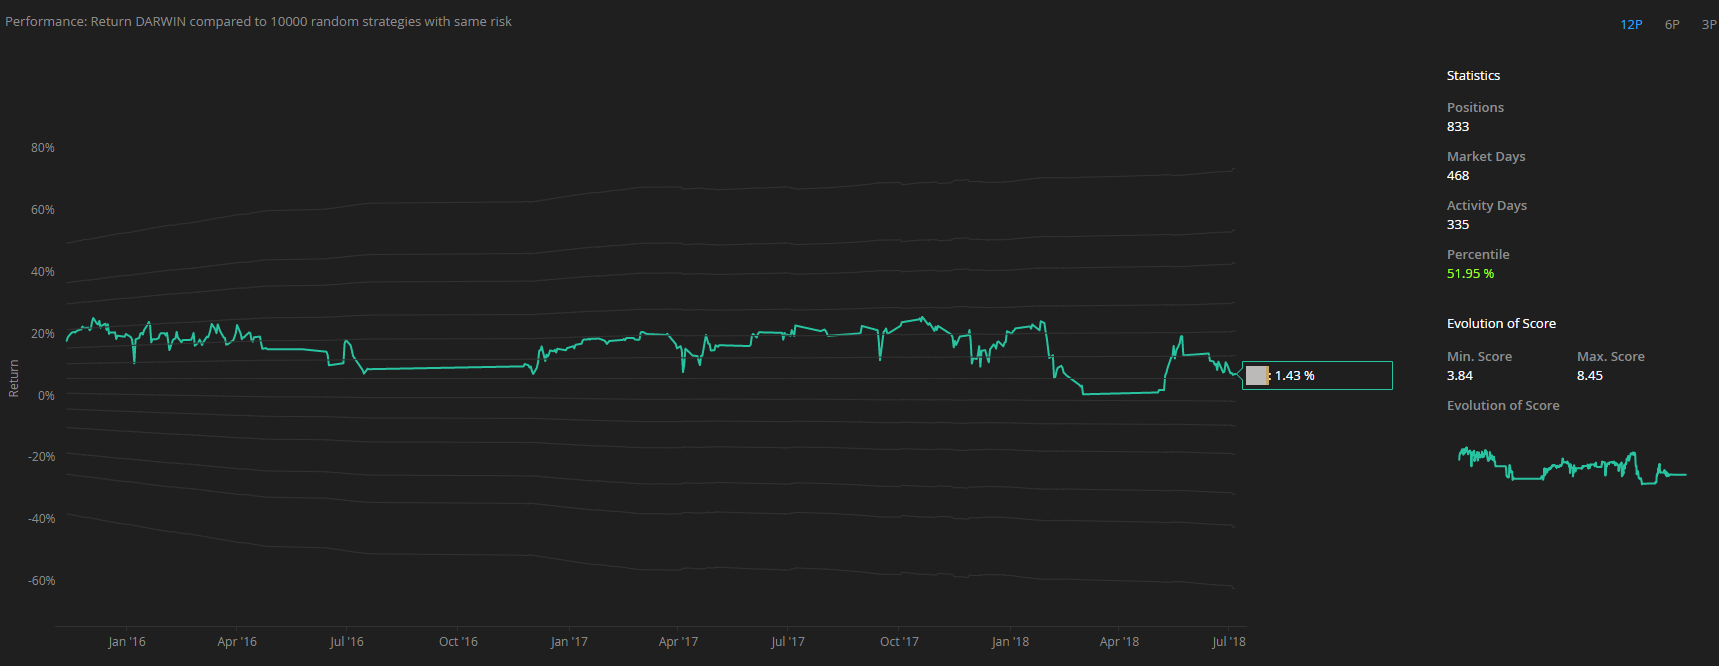
This DARWIN has a Pf score of 5.1
Over time the Pf score has fluctuated substantially and suffered a steep decline from 8.45 to 3.84 before starting to recover.

- Poor score
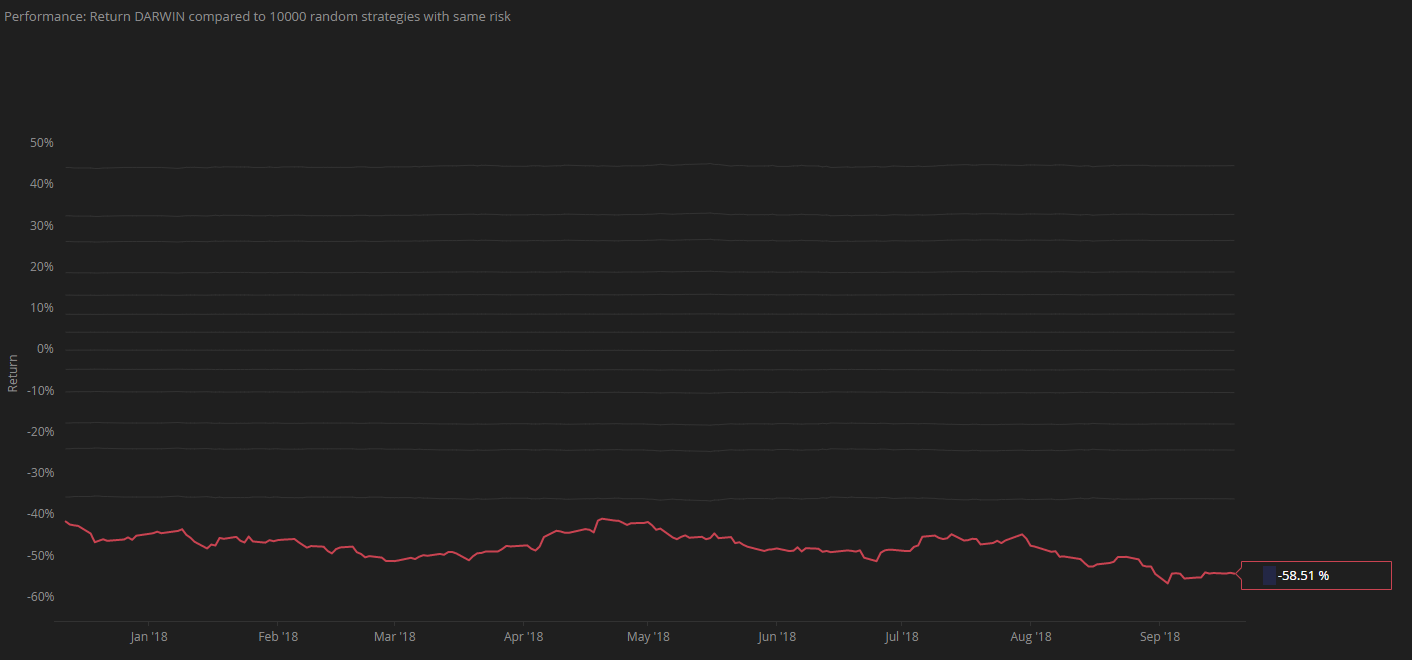
This DARWINs Performance (Pf) score has never really taken off.
