What is it?
The Trading Journal offers a very useful overview of a trader's trading style via an analysis of their historic operations.
It is important because an ability to understand it means that you will be able to discard certain risky strategies, like martingales, at a glance.
Below we detail the information you can find within the Trading Journal.
1. Return
A graph showing the equity curve of the underlying strategy.
2. Risk
A graph showing the D-Leverage involved in every position of the underlying strategy
3. Open trades
A graph in which you can see the number of simultaneously open trades that in aggregate form a position.
4. D-Score
A graph showing the historic evolution of the D-Score.
5. Trade distribution
A visual representation of horizontal bars showing the totality of trades the strategy opened that specifies the underlying asset traded, the length of time the trade was open, and the date of open and close.*
*This information is only available if the trader has not decided to hide his underlying trades.
Further detail
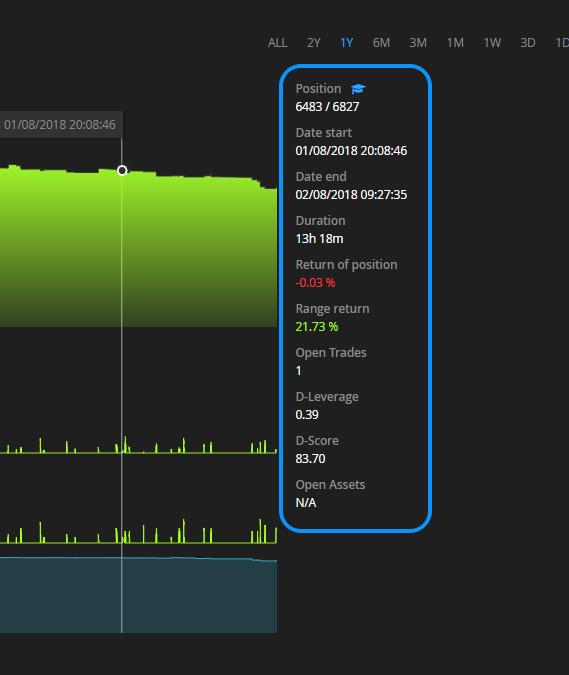
In addition to these 5 graphs, the Trading Journal has a column on the right-hand side containing detailed information specific to a given position.
By moving your mouse over a position on the graph, this information will automatically update with information specific to the position in question.
Where can I find the Trading Journal?
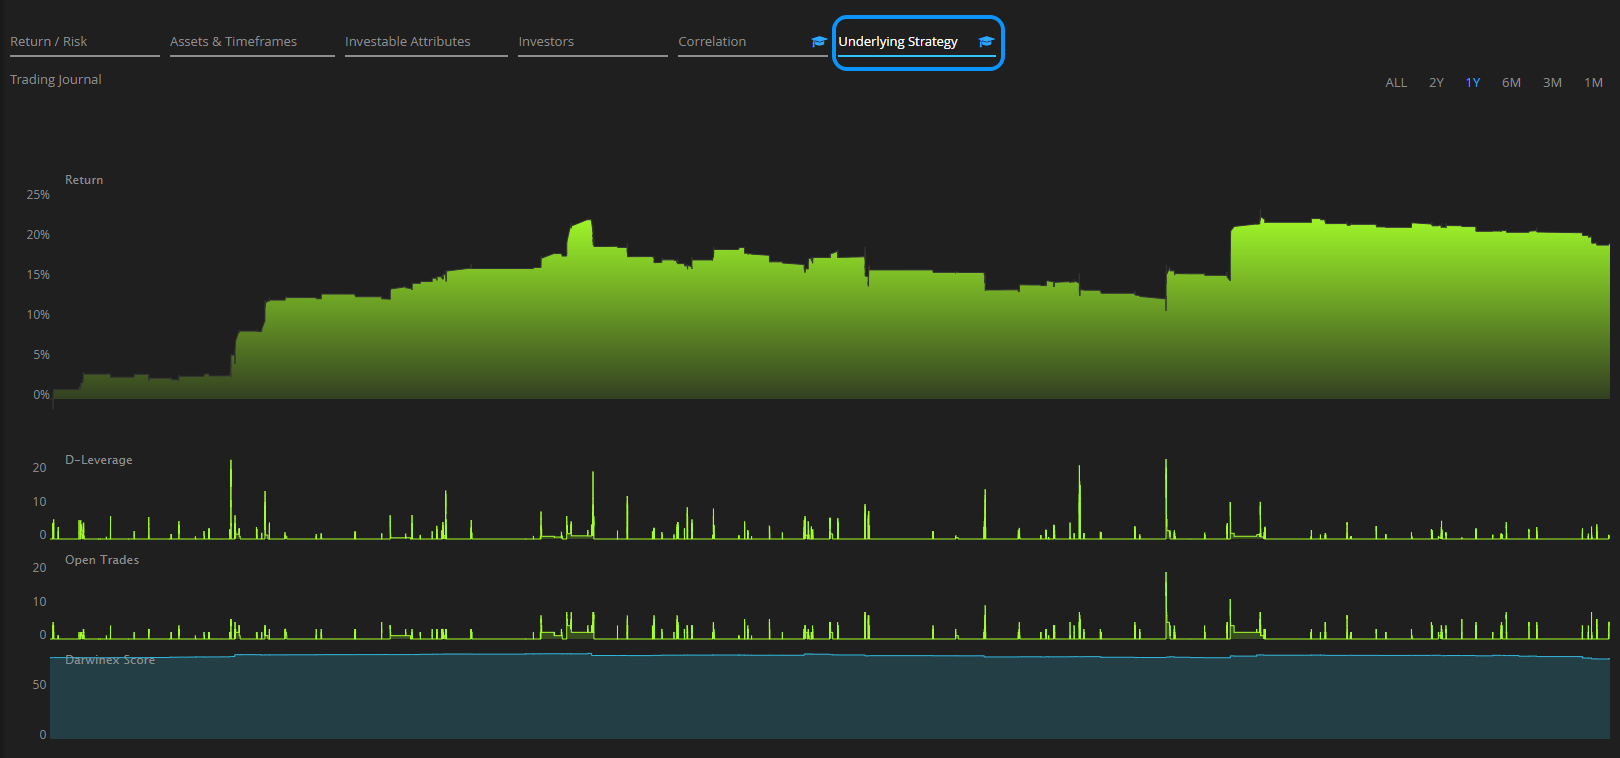
You can access the Trading Journal from two locations:
- From a DARWINs profile by clicking on the "Underlying Strategy" tab
- From the strategy itself by clicking on the "Trading Journal" tab
Trader Configuration
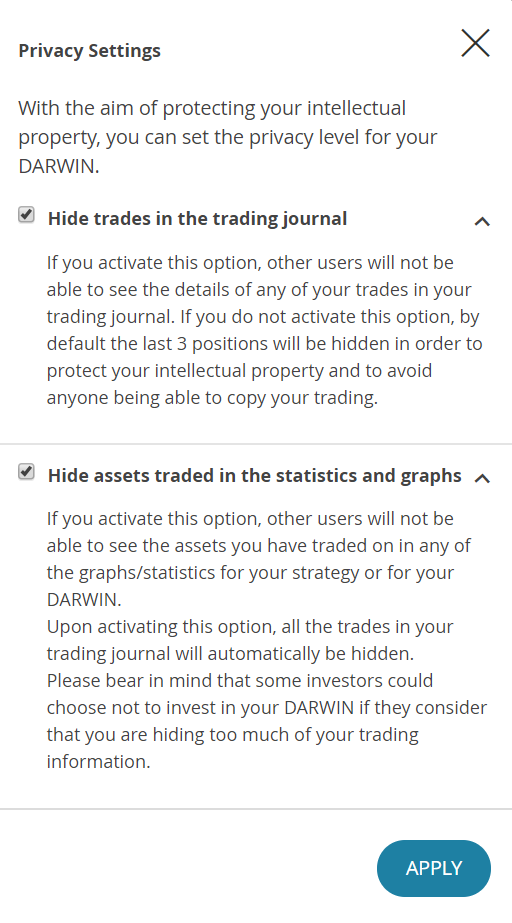
A trader has the possibility of hiding their trades so that other users cannot see their details.
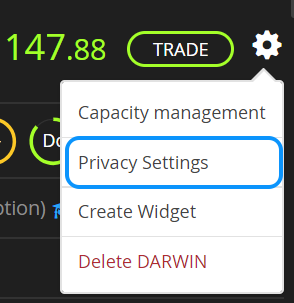
To do so, proceed to the settings section within the underlying strategy and click on the relevant option as in the images below.
Traders should think long and hard before deciding to activate their privacy settings as many investors are reluctant to invest in DARWINs that are less transparent.
As such, unless you firmly believe that a failure to hide your trades will result in losing your edge, we recommend that you do NOT activate these settings and so maintain maximum transparency.
Use cases
Below we analyze a few Trading Journals to see what conclusions we can draw from a trader's activity.
Example 1
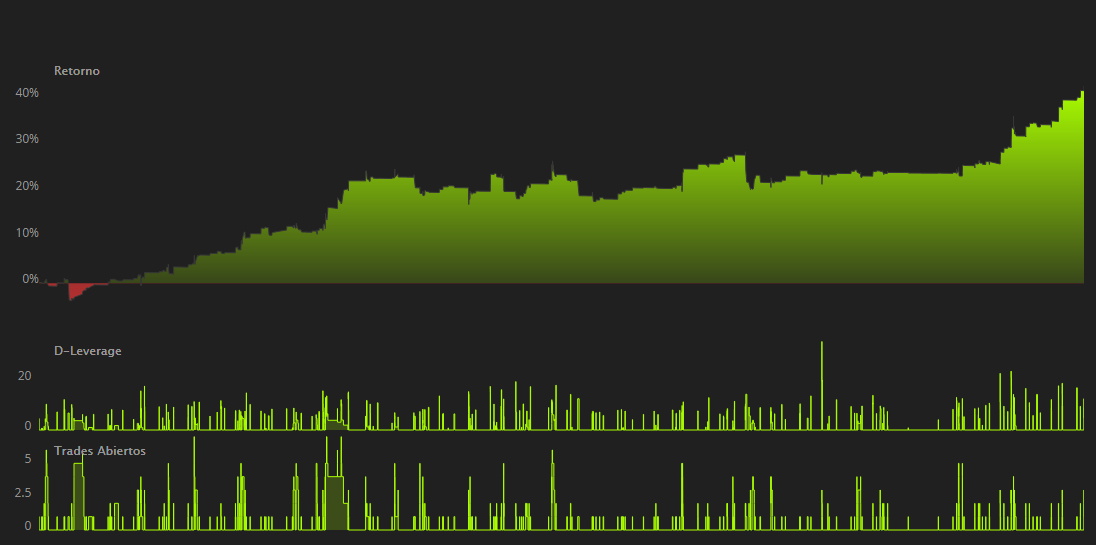
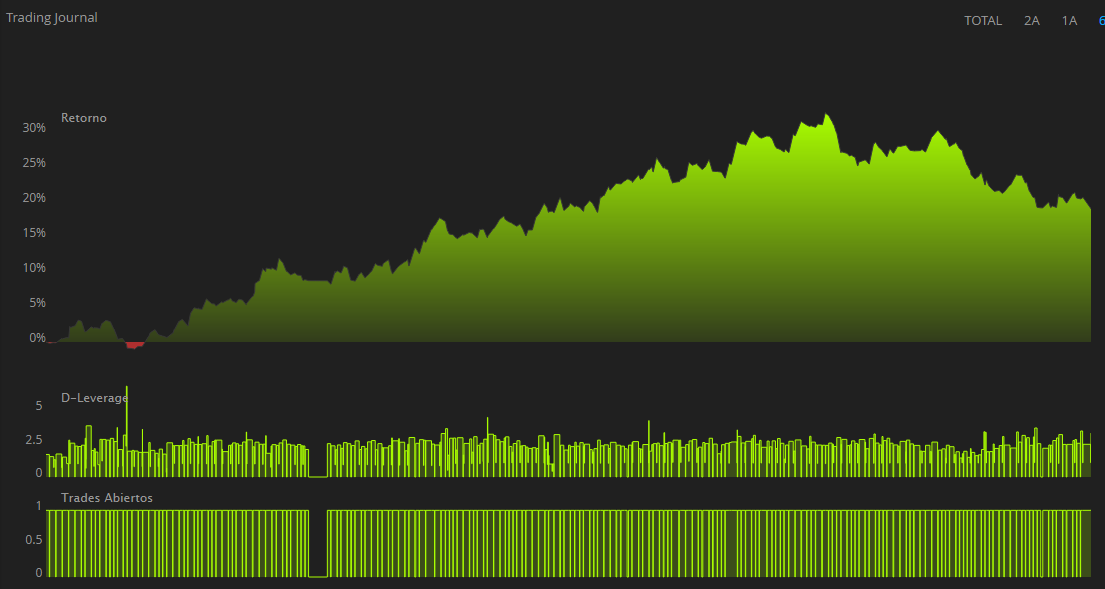
Here we have a strategy with:
- Constant exposure to the market.
- A consistent level of D-leverage.
- No more than 1 trade opened at any given time.
Independently of any further analysis you might want to carry out, you already have a wealth of information within the Trading Journal.
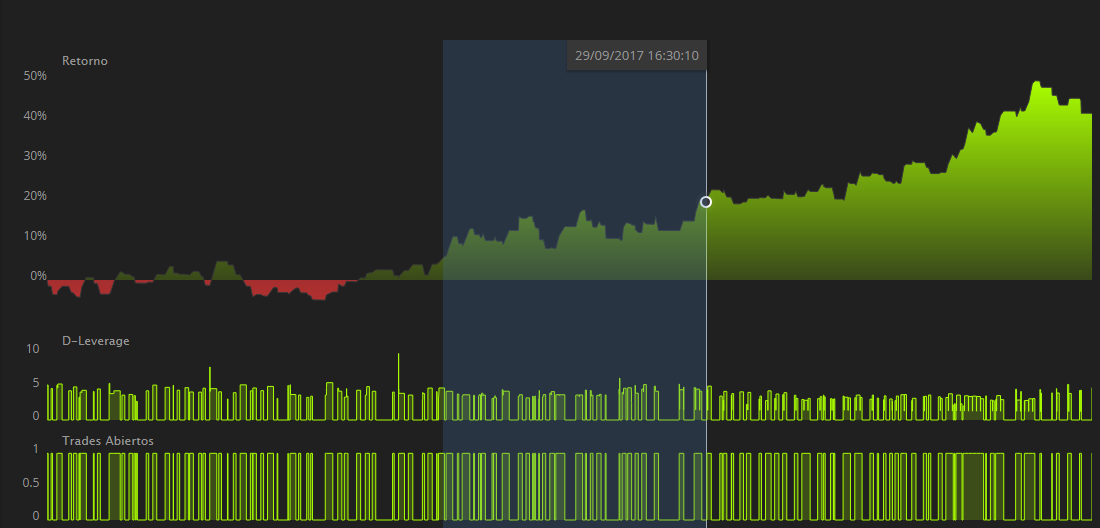
Example 2
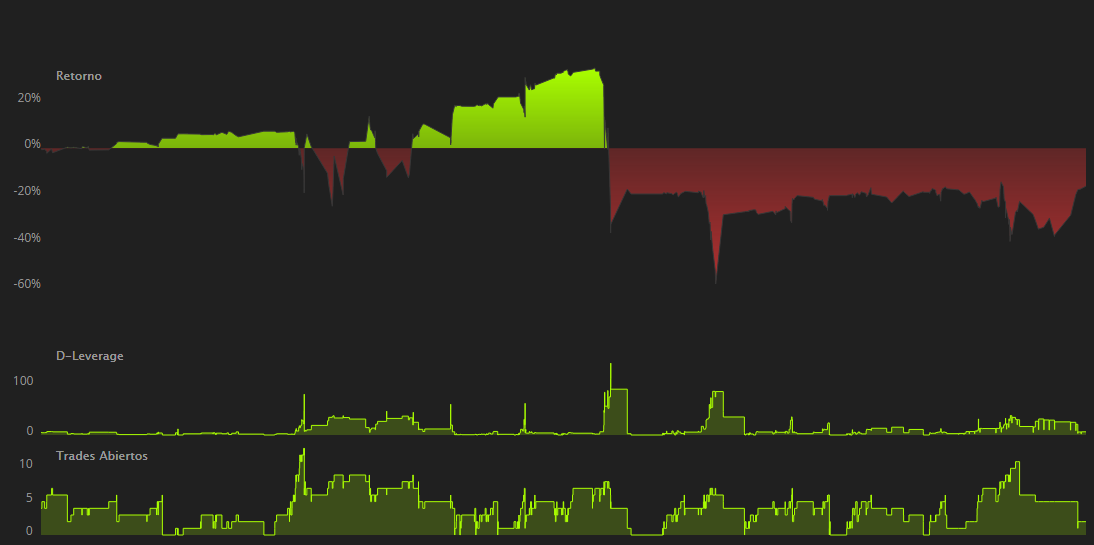
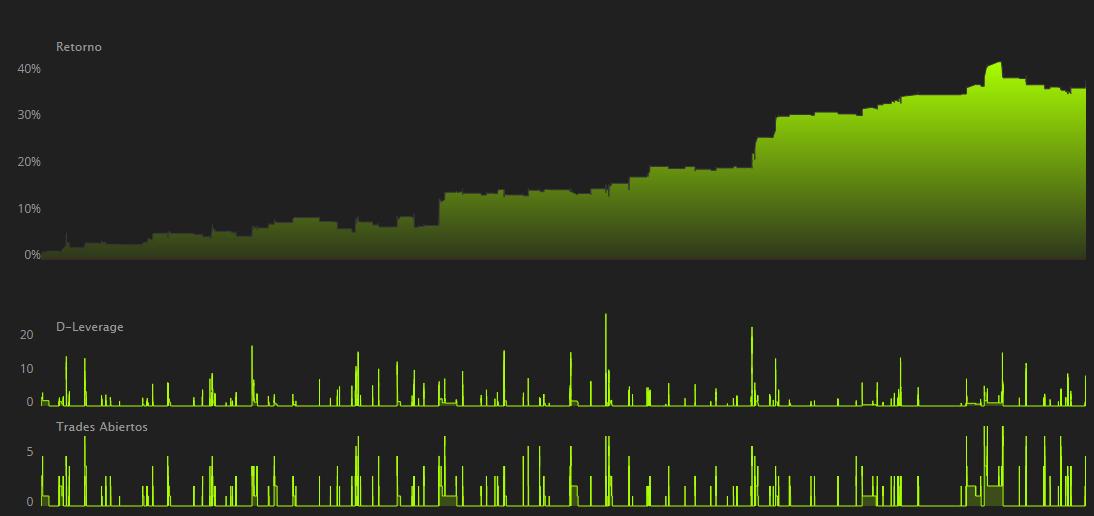
In this second strategy we can observe:
- Much less continuous exposure to the market.
- A relatively high D-Leverage per position.
- A relatively short trading time frame with scaled entry and exits.
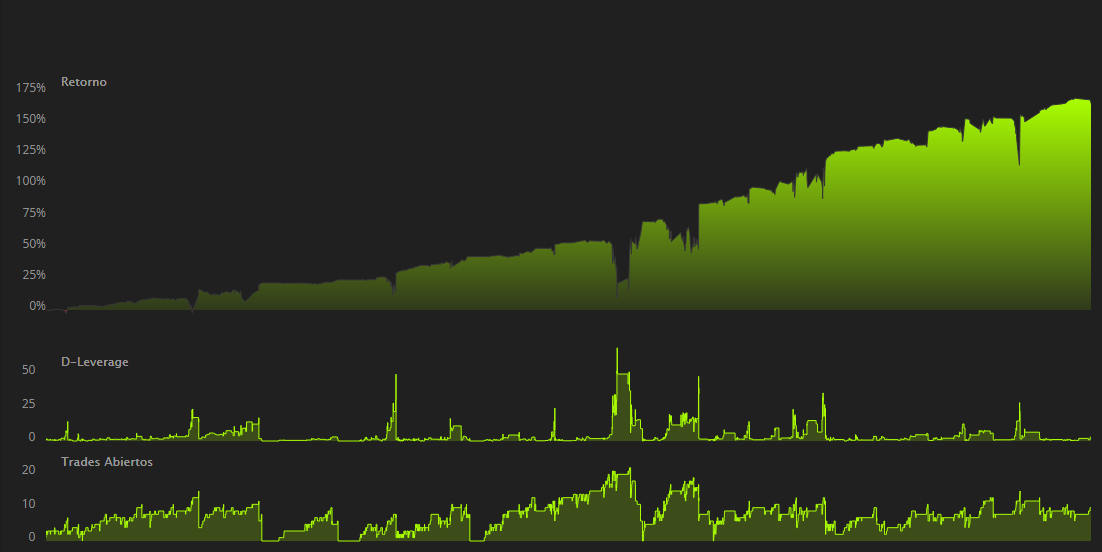
Example 3
In our third example we can notice:
- A strategy with sudden significant spikes in D-Leverage, accompanied by
- An increase in the number of open trades, generally coinciding with
- A substantial decrease in the account equity
This type of behavior is consistent with a high-risk strategy, commonly called a martingale.
Tips
1. Zoom
To facilitate a better viewing experience, left-click your mouse button and drag to zoom in on a specific period of time.
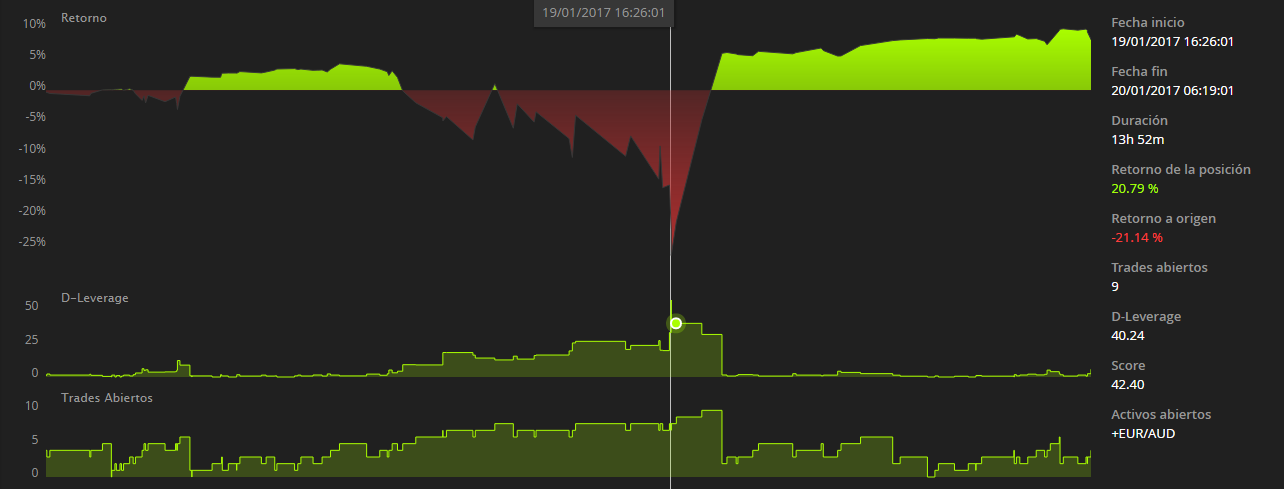
2. Identifying Martingales
As detailed in example 3 above, a martingale is characterized by a simultaneous increase in the number of opened trades and D-Leverage, and a decrease in the account equity.
The zoom functionality comes in handy to study timeframes exhibiting these characteristics in depth.
In the example below, we can see that while the number of open trades was increasing, the trader was not diversifying, rather he was adding more long positions in the EURUSD.
3. Risk Stability (Rs)
Although there is a specific Risk Stability (Rs) Investable Attribute with its own score, over time you will be able to intuitively understand the evolution of its score by looking at the Trading Journal.
A consistent level of D-Leverage is usually indicative of a high Risk Stability (Rs) score, whereas an erratic D-Leverage is usually a symptom of poor risk management by the trader which will be heavily penalized in the Rs score.