What is correlation?
The correlation measures the degree to which two DARWINs' returns move in relation to each other.
Do they move in a similar fashion, or are they completely different?
This information is very important when it comes to creating a portfolio of DARWIN because, if the DARWINs are highly correlated, not only are we not diversifying but in effect, it would be the same as investing all our capital in just one DARWIN.
The results of a correlation coefficient are measured between +1 and -1.
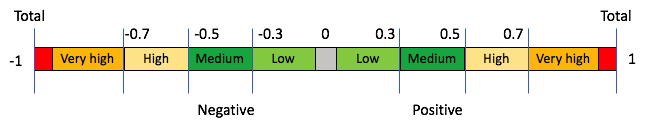
- A value of 0 implies a complete decorrelation. Their returns move independently from one another.
- A value of 1 implies the maximum correlation, or perfect positive correlation, in other words, there is a degree of dependency between the two DARWINs. When one of their quote prices rises, the other will also rise by the same proportion.
- A value of -1 implies the maximum inverse correlation or a perfect negative correlation. This means that when one of the DARWINs increases its quote price, the other will decrease by the same proportion.
- Values beyond +0.7 or -0.7 are considered highly correlated.
Where can this be checked?
All DARWINs have a ''Correlation'' tab made up of a correlation chart, as well as a graph where the return curve's movements for both DARWINs is shown.
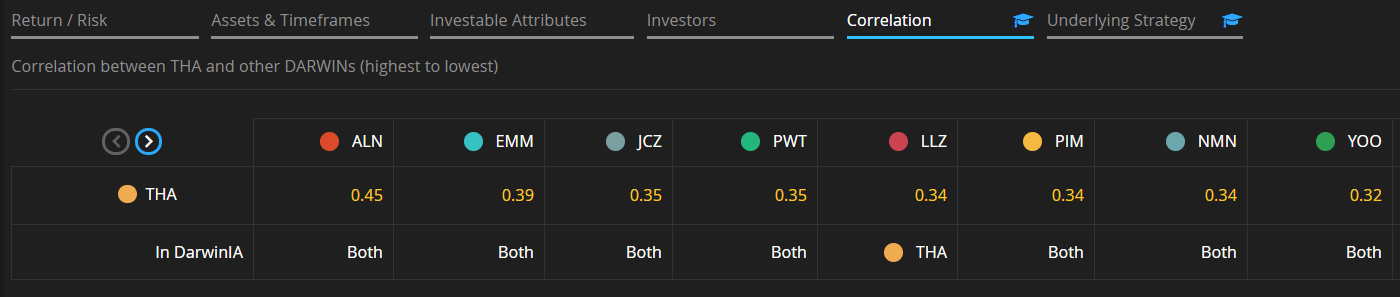
Correlation Chart
This shows us the 10 most highly correlated DARWINs compared with the chosen DARWIN.
By clicking on the arrows just above the chosen DARWIN, you can see the next 10 most highly correlated DARWINs and so forth.
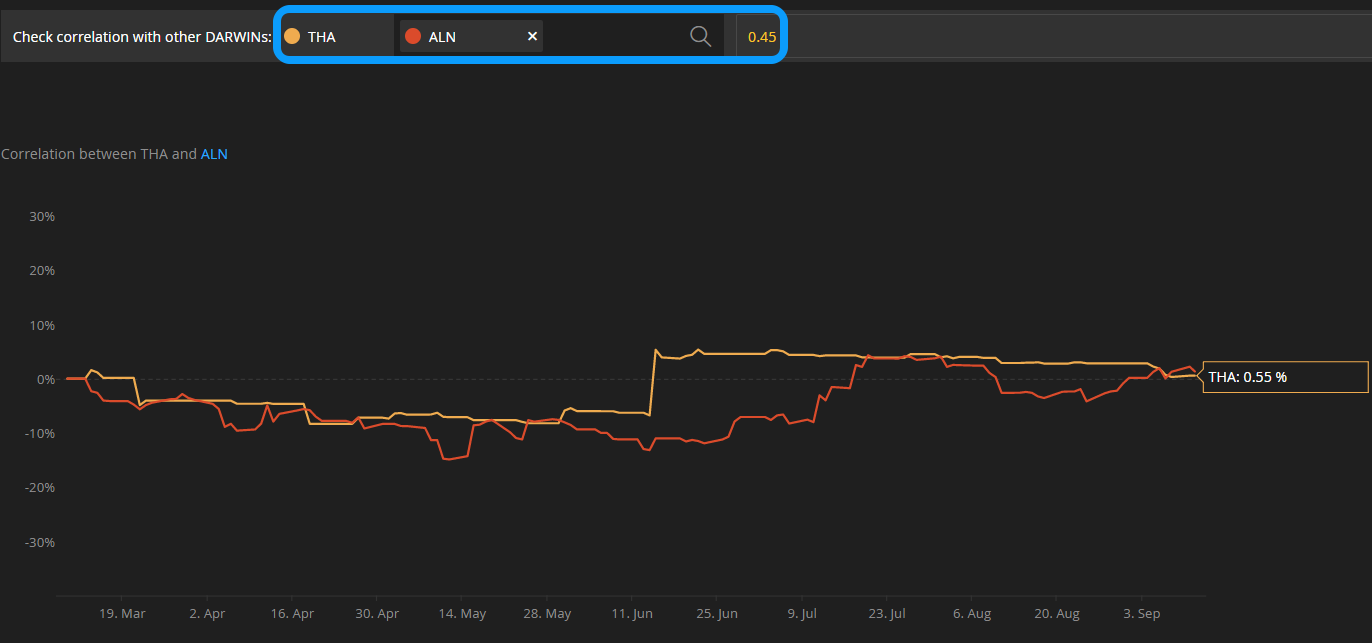
Return Curve's chart
You may use this to compare the returns between two DARWINs.
In addition, you can use the search bar to change the DARWIN which you want to compare by simply entering the ticker as shown below.
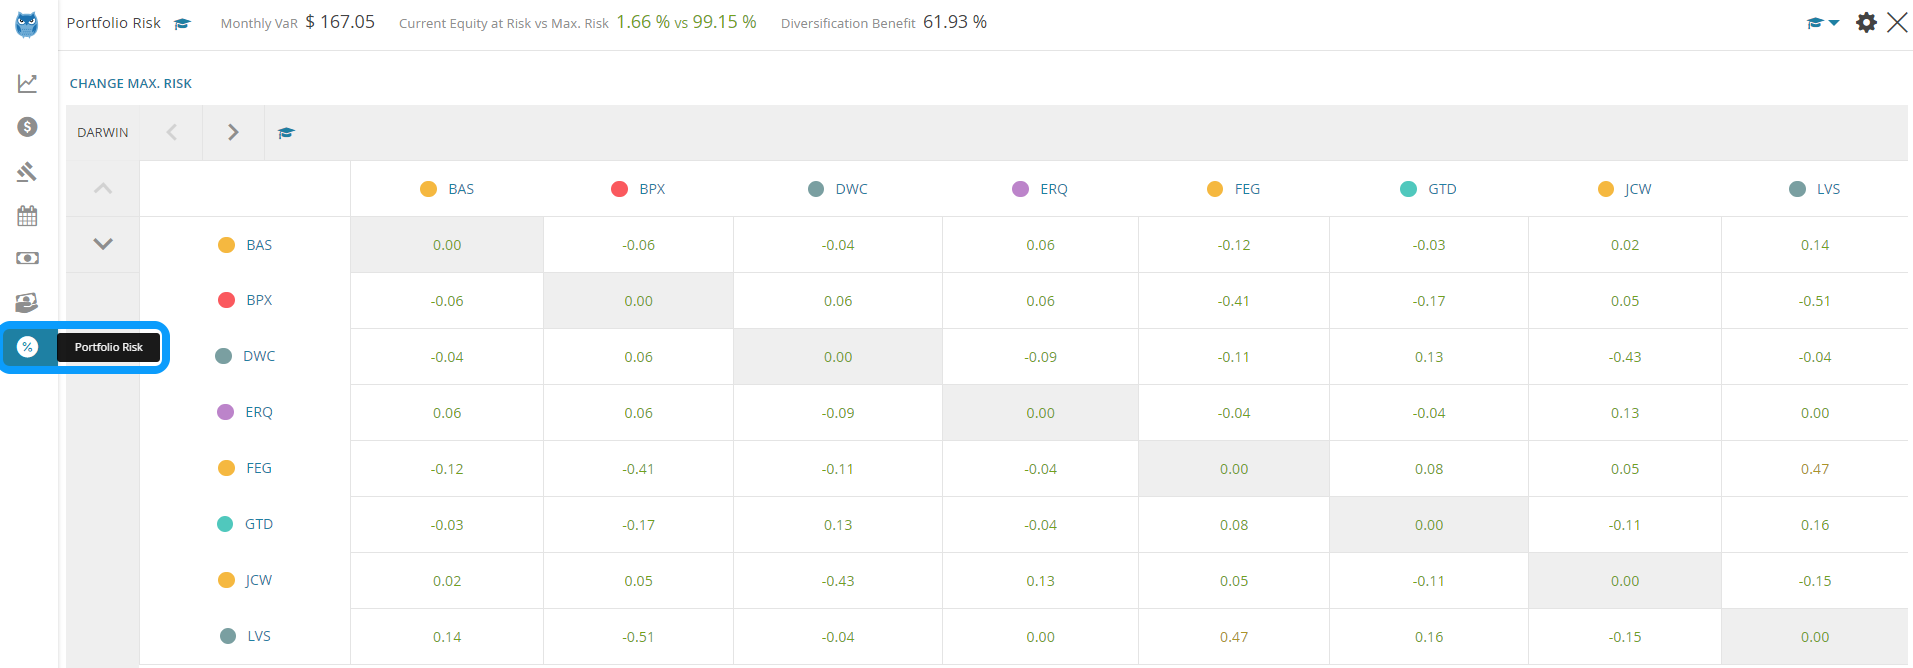
Furthermore, in the ''Porfolio Risk'' section, inside the DARWIN Terminal, you will have access to a correlation matrix which will show the correlation between all the DARWIN in which you are currently invested.
High and low correlation
Let's look at two cases of high and low correlation so as to ensure that you have fully understood the concept.
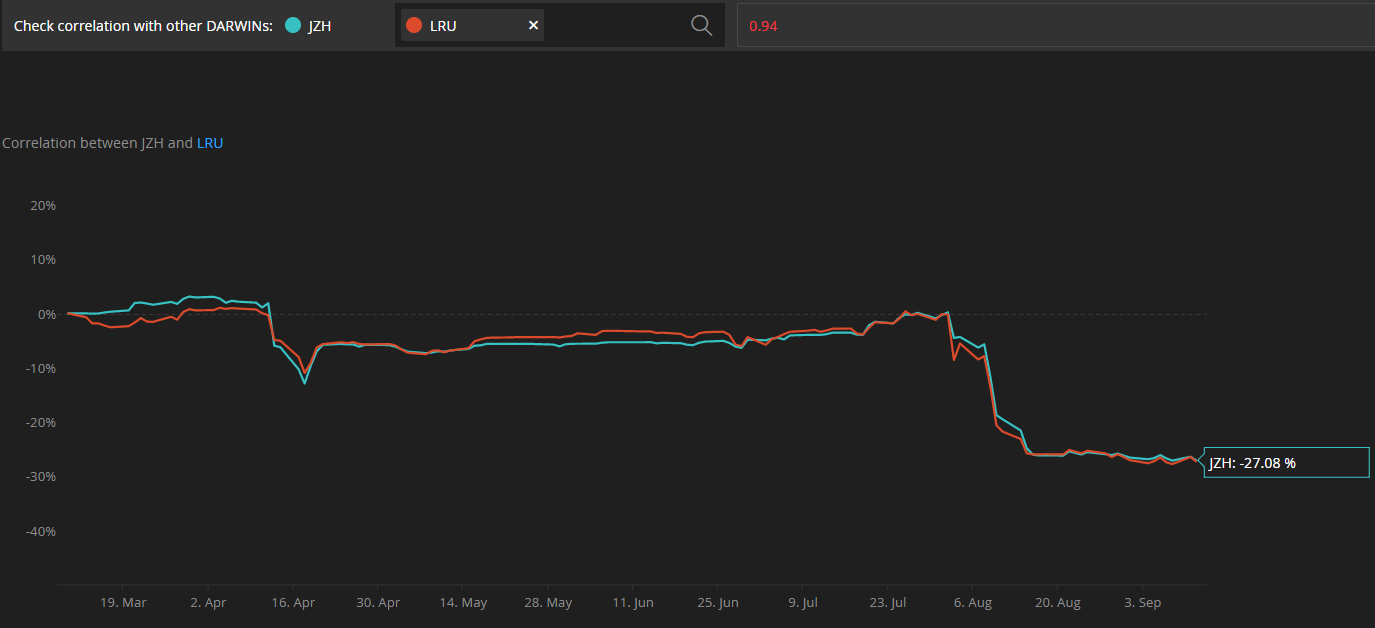
High Correlation
At a quick glance, you can see that these DARWINs' returns have moved symmetrically, therefore their correlation is 0.93.
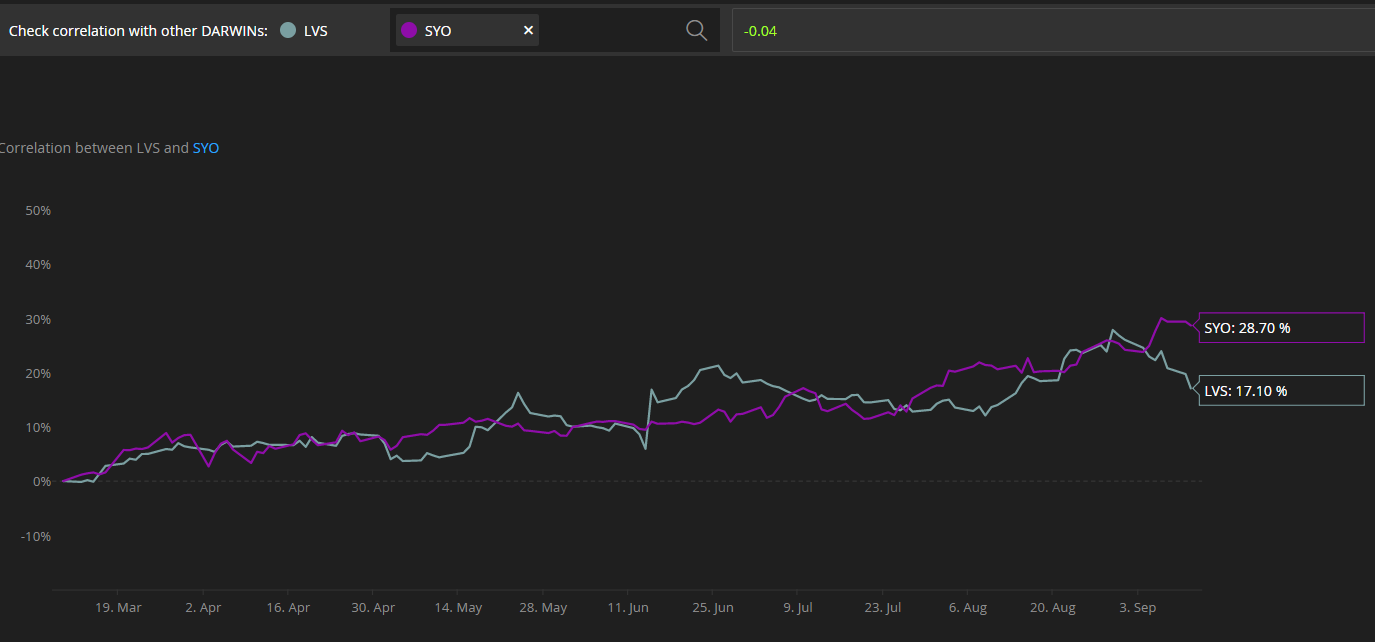
Low Correlation
On the other hand, these two DARWINs, which returns have moved independently from each other, show a correlation of just -0.07.
Tips
1. Diversify to mitigate risk
At Darwinex we recommend investing in a diversified portfolio of DARWINs so as to minimize the portfolio's risk.
In order to do so correctly, check that the DARWINs you choose do not show a high correlation, either positive or negative.
2. Between -0.7 and +0.
Those DARWINs which have values between -0.5 and +0.5 are considered to be decorrelated. Beyond these values, correlation starts to become a factor to take into account when choosing DARWINs.
3. Correlation evolves
The fact that two DARWIN have been highly correlated for a time does not mean that their correlation value will remain the same throughout the future since correlation evolves with time.
The opposite is also true, so you have to periodically check your portfolio of DARWINs and ensure that there are no high levels of correlation among them.
Do you want to learn more?
We use the standard correlation formula taking into account last 3 months.