What is it?
A drawdown refers to a decrease or decline.
Applied to financial markets it is the worst series of accumulated losses in a given period i.e the peak-to-trough decline in the return curve.
While the drawdown has significant limitations when it comes to measuring the risk of a financial asset - at Darwinex we use Value-at-Risk (VaR) to measure risk- it is useful in that it gives a snapshot allowing us to see the maximum loss suffered in a given period versus the return obtained.
Drawdown shows what has happened in the past while VaR shows what could happen in the future with a given probability.
How is it calculated?
To calculate the drawdown for a historic time series, we first calculate the distance from peak to trough in the asset's return curve as illustrated in the image below.
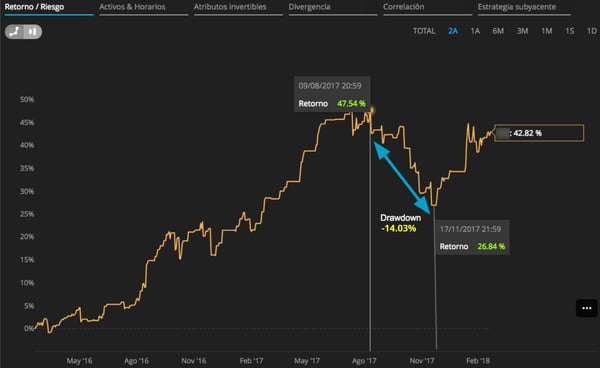
Here we can see that, over the course of 2 years, the DARWIN obtained a maximum return of 47.54%.
This "peak" return was achieved on 9th August 2017.
Subsequent to this peak, the DARWIN suffered a sustained period of losses over more than 2 months through the 17th November 2017, at which point the total accumulated return was 26.84%.
This marks our "trough".
To obtain the drawdown we do the following calculation:
[((1+0.2684)-(1+0.4754))/(1+0.4754)]*100 = -14.03%.
What does this mean?
Someone who had invested at the beginning of the time series would have achieved a total return of 42.82%, suffering a maximum drawdown of 14.03%.
This gives a Return/Drawdown of 3.05.
The maximum drawdown period will not finish until the total return is once again above the "peak" (47.54% in our example).
As such, this DARWIN on our example is still within its maximum drawdown period.
Where can I find it?
Drawdown information for both DARWINs and trading strategies can be found in two locations.
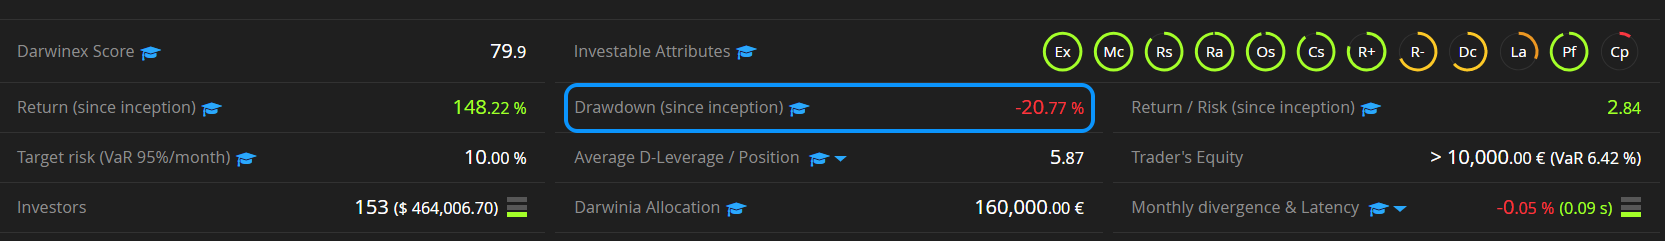
- Drawdown (since inception)
Information related to the maximum drawdown since the very start of the strategy, along with the other most relevant statistics, can be found in the table at the top of the DARWIN or strategy profile.
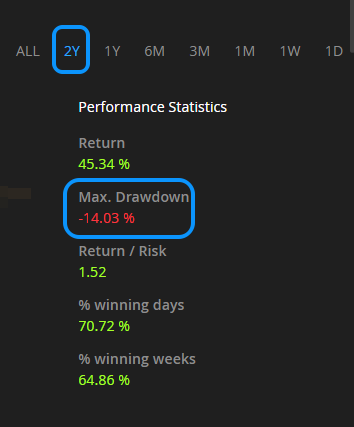
- Maximum drawdown for a given period
This value fluctuates in accordance with the time period selected on the Return/Risk tab within the DARWIN page and can be seen to the right of the return graph.
Update frequency and data precision
- The drawdown of DARWINs is updated once per hour.
- Drawdown of trading strategies (live strategies with or without DARWIN or demo trading strategies) is updated once per day, during the European nighttime.
Data used to calculate drawdown
For each year of a DARWIN track record, there’re more than a million quote data values. Therefore, it’s not viable to calculate drawdown off tick-level data, not even off minute-level data.
-
DD since inception (upper section of DARWIN profiles)
The input data for calculating “DD since inception”, like most of the rest of the data displayed in the upper section of a DARWIN profile, is taken…
- every 6 hours for the last month,
- every 12 hours for the last 3 months, and
- every end-of-day (EOD) for the rest of the track record
This is the data that’s used for the filter criteria “Drawdown” and “Return / Drawdown ratio”.
-
Max. Drawdown (next to DARWIN return graphs)
The “Max. Drawdown” displayed next to the DARWIN return chart is an estimation based on what’s shown on the graph at any moment of time and does not take into account 100% of the values shown on the chart.
Therefore, it must not match the value shown as “DD since inception” in the upper section of a DARWIN profile, not even when the timeframe selected for the graph is “ALL" time”.
Having said that, these two values will tend to converge.

Tips
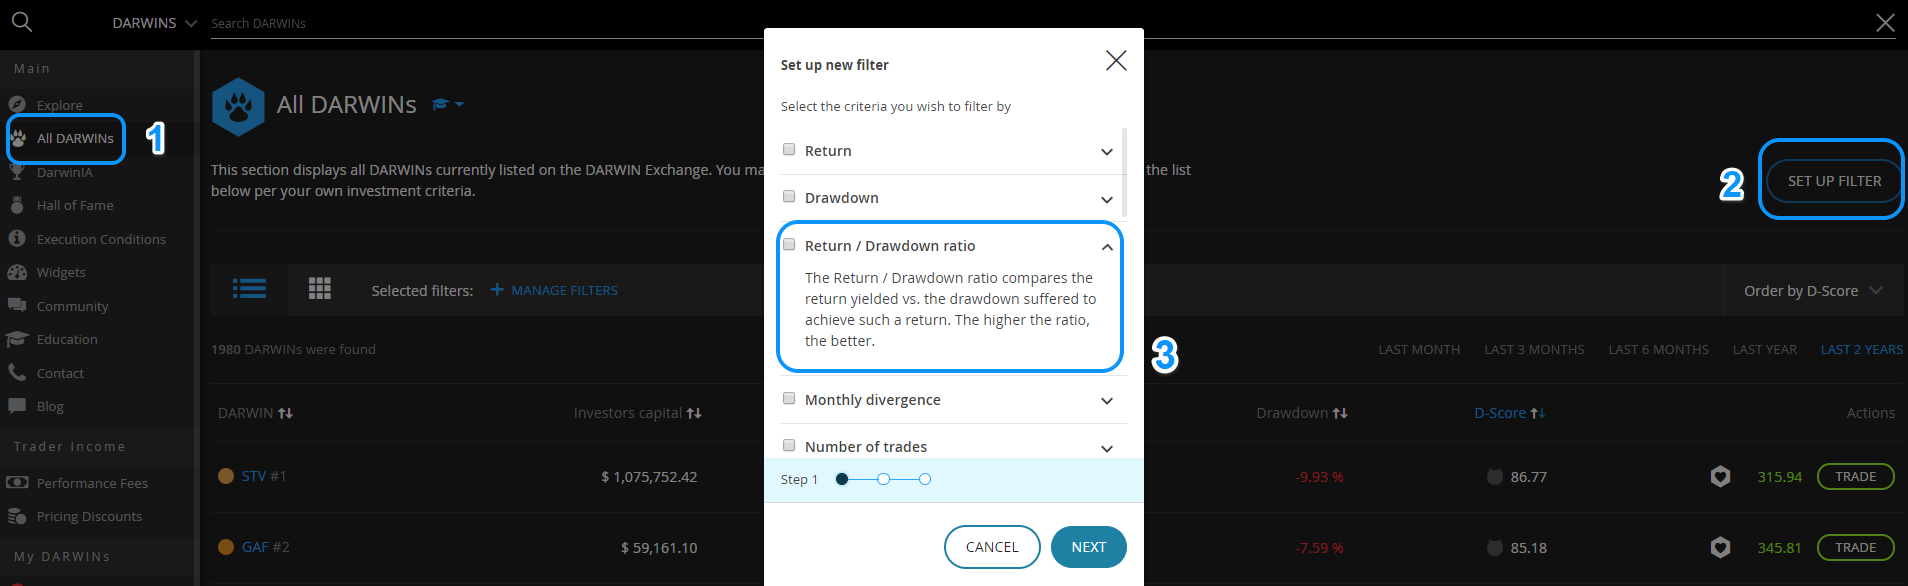
- Order lists by drawdown: You can use our pre-defined filters and order these by drawdown.
- Custom filter: You can create a custom filter for a ratio of "Return to Drawdown" using the Return / Drawdown ratio criteria.
- Drawdown measures the past: Drawdown is calculated based on past results and as such its predictive power is limited.
- Drawdown timeframe: An asset with a 20% drawdown after 3 years of operations is likely to be less volatile than an asset with the same drawdown in its first two months of operations.