The Positive Return Consistency (R+), Negative Return Consistency (R-) and Duration Consistency (Dc) Attributes analyze behavioural patterns associated with the closing of positions.
They measure the dispersion / concentration around the length of time a position remains open and the return in pips of the positions.
These attributes are scored from 0-10 and take into account the last 3 D-Periods of Experience (Ex).
1. Positive Return Consistency (R+)
R+ analyses the decision to close positions in a given asset that have generated a positive return.
Greater consistency in the closing of winning positions in terms of the return in pips indicates that the trader is being systematic in his decision making, using pip return as the criteria. This gives rise to a higher R+ score.
Placing Take Profit orders at a similar level across positions in a given asset will result in an excellent R+ score.
2. Negative Return Consistency Negativos (R-)
R- analyses the decision to close positions in a given asset that have generated a negative return.
Greater consistency in the closing of losing positions in terms of the loss in pips indicates that the trader is being systematic in his decision making, using pip loss as the criteria. This gives rise to a higher R- score.
Placing Stop Loss orders at a similar level across positions in a given asset will result in an excellent R+ score.
3. Duration Consistency (Dc)
Dc analyses patterns in respect of the length of time a position in a given asset remains open.
Greater consistency in the closing of positions in accordance with the length of time the position has been open indicates systematic decision-making based on time.
The higher the consistency the higher the Dc score.
Where can I see this information?
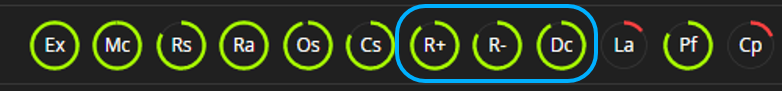
As with the rest of the Investable Attributes, you can access this information via the icons in the top right of the DARWIN or Underlying Strategy profile.
It can also be consulted from within the profile via the ["Investable Attributes" / "R+" / "R-" / "Dc"] path.
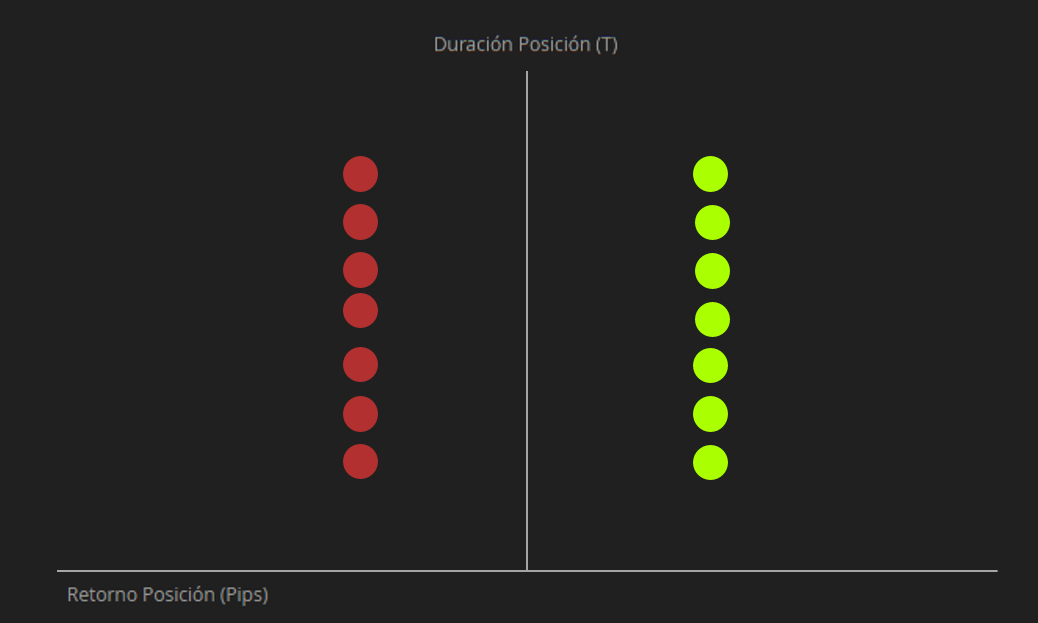
- Return Consistency +/-
Looks for return consistency in pips* when closing positions in a given asset.
*Calculated as: [(Close price - Open price)/(Open price)] *10000
In this graph, you can see the last 50 winning positions (represented by green bubbles) and the last 50 losing positions (represented by red bubbles).
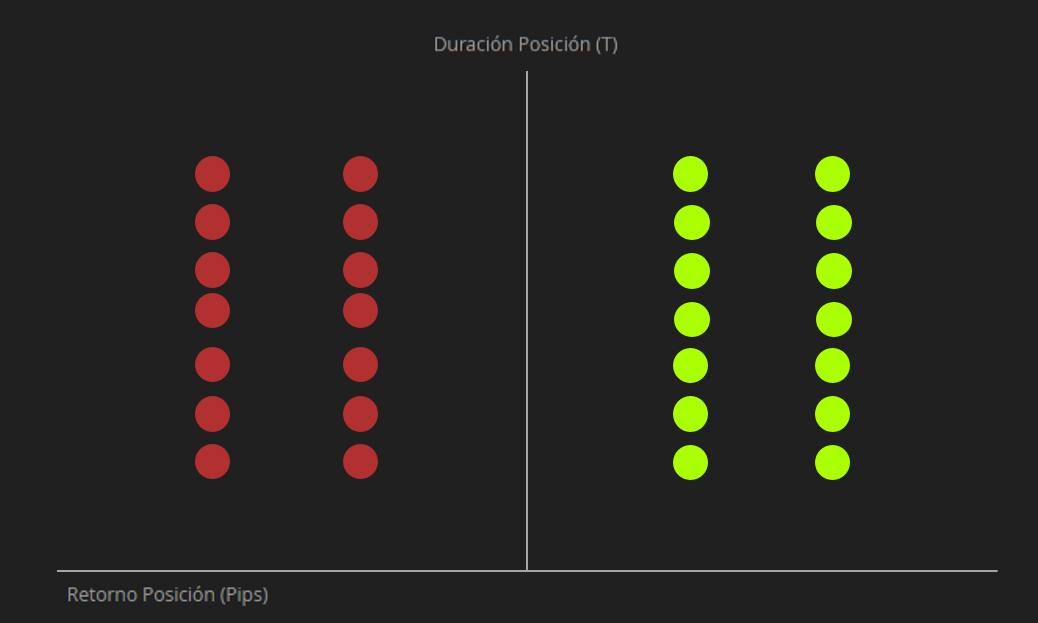
In the illustration below you have an extreme example of perfect R+ and R-.
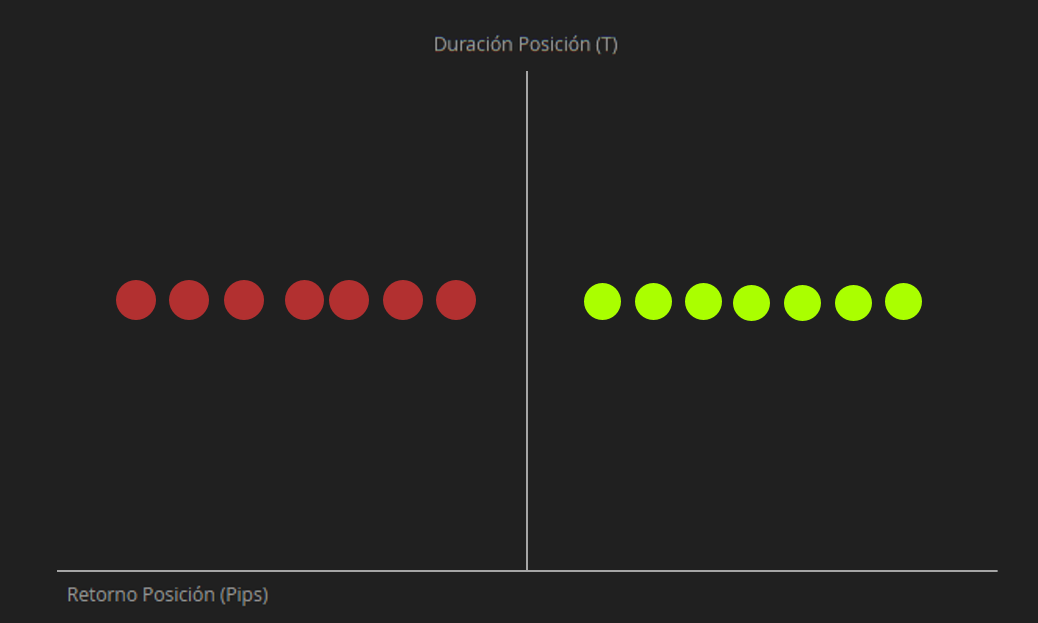
- Duration Consistency
Looks for consistency in the length of time a position remains open.
In this section, you will see a graph with the last 100 closed positions.
In the illustration below you have an extreme example of perfect Dc
Size of the bubbles
The calculation of the score for these three Investable Attributes depends not only on the dispersion / concentration of decisions, but it also takes into account the relative importance of the position versus other positions.
By doing this we avoid penalizing Consistency scores where there are outlying positions so long as they not representative of the overall observed pattern.
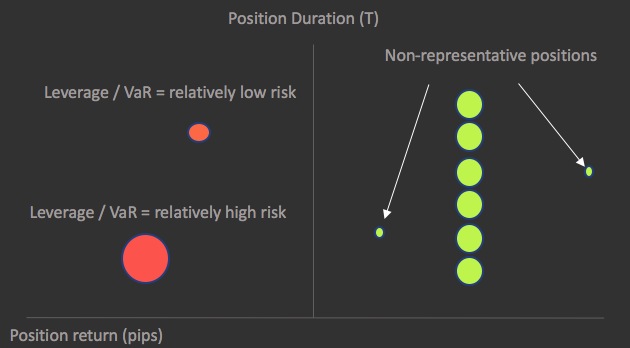
The size of the associated bubble gives us an indication of the relative weight of each position in the strategy.
The formula that determines the size of the bubble is:
[(Leverage * √duration * VaR DARWIN) / (VaR of Underlying Strategy at the close of the position)]
Examples of R+, R- and Dc scores
If you are a DARWIN investor you should know that good R+, R- and Dc scores imply clear and systematic criteria when it comes to closing positions.
However, you may come across DARWINs that have good scores in the Risk Stability (Rs), Risk Adjustment (Ra) and Loss Aversion (La) Attributes, but whose R+, R- and Dc scores are not so high.
This can occur with strategies that use variable return targets that may depend on the level of volatility or the strength of a trend.
These situations ordinarily lead to a greater dispersion in position returns and therefore lower R+, R- and Dc scores without necessarily implying that the trading strategy is a poor one.
- High Dc Score
This DARWIN has a Dc score of 9.8 and it can be clearly observed that the underlying criteria for closing trades is based on time and not the return.
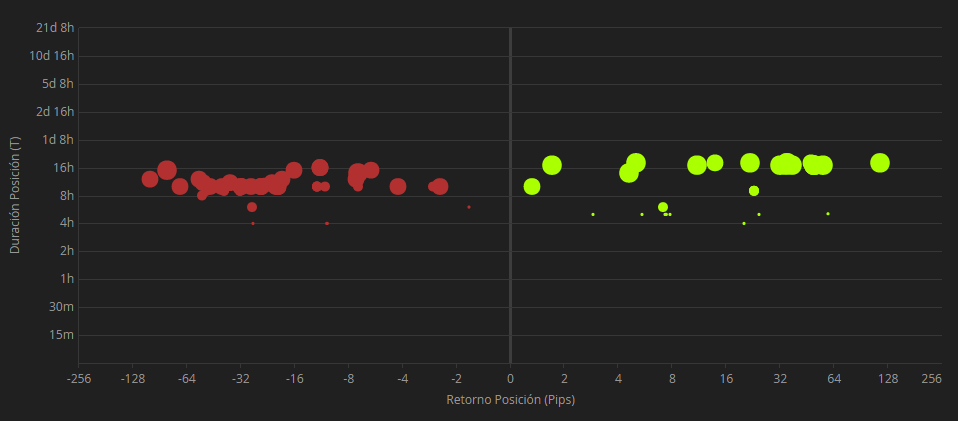
- High R- score
Here you can see a DARWIN with very consistent negative returns and little dispersion indicating losses are strictly controlled.
On the other hand, positive returns are less concentrated.
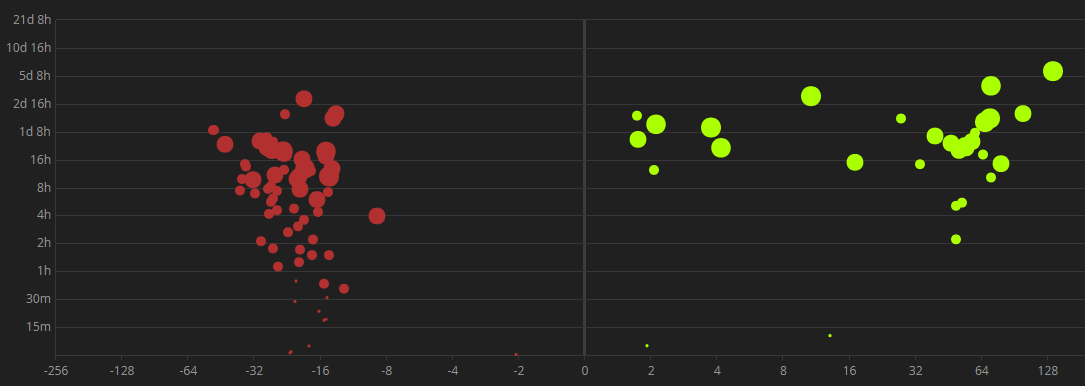
- High R+ and R- scores
This DARWIN is particularly meticulous in terms of closing positions based on returns.
In spite of what you might think, the graph does actually show the last 50 winning and last 50 losing positions.
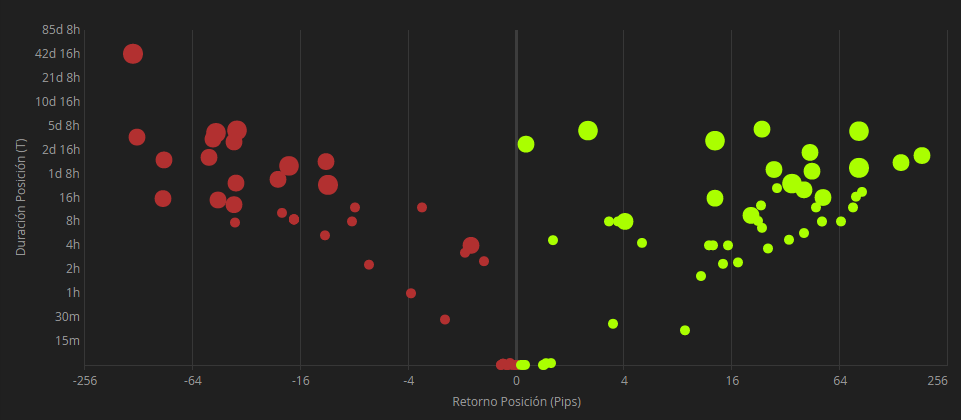
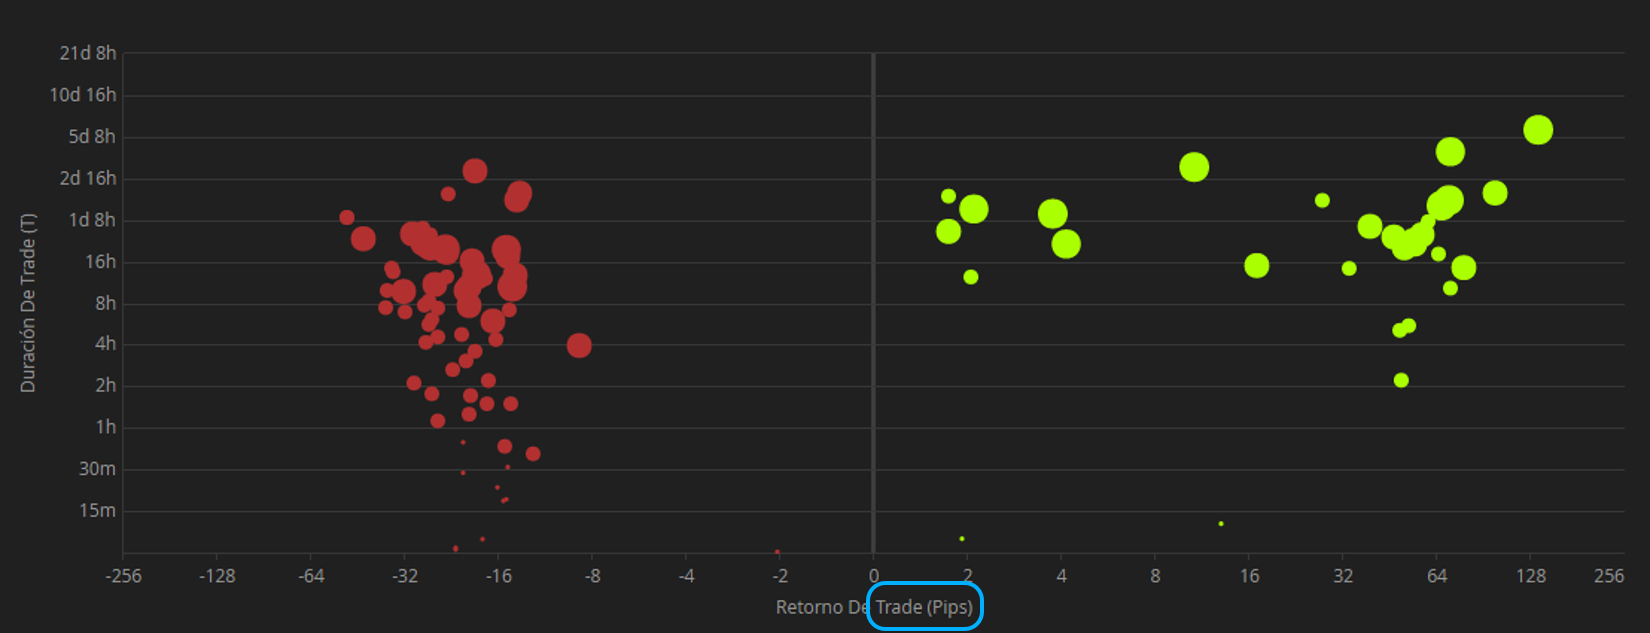
- Low scores in R+, R- and Dc
In this last example, we show a DARWIN which employs no apparent time or return-based criteria for closing positions.
Some positions have been closed in minutes, others have been open upwards of 40 days, while some have generated just a few pips in profit or loss and others have reached almost 200.
Tips
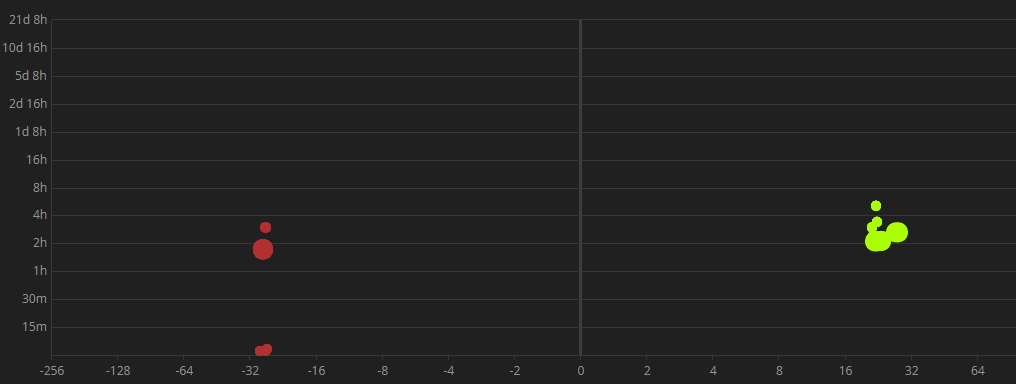
1. Combining trading strategies
The algorithm detects multiple centers of consistency.
As such a trading account that simultaneously operates various strategies with different Stop Loss / Take Profit / duration objectives will not necessarily see an excessive penalization in its R+ / R- / Dc scores.
Nevertheless, there must be consistency within the individual strategies in order to obtain a good R+ / R- / Dc score.
We can see an extreme example of this in the illustration below:
2. Trades vs. Positions
R+ / R- and Dc scores are calculated on the results of positions in an asset.
The graphs in these specific sections represent positions but it is also possible to see graphs at the individual trade level.
To access this trade level information, please go to the ["Assets & Timeframes" ] tab.
For more information on the difference between Trade and Position, please see this article.
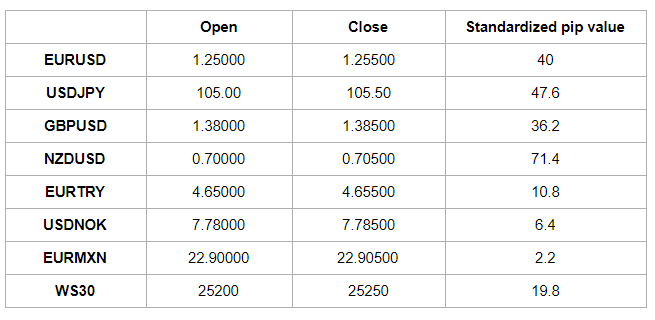
3. Pip value standardization
In Darwinex you can trade diverse assets with very different price levels.
For this reason, we have standardized the pip value calculation in accordance with the following formula:
Pip value = [(Close price - Open price)/(Open price)] *10000
Consequently, although you might close positions with a similar pip value return, if they reference different assets you might see some dispersion in the R+ / R- graph.
Let's look at some examples in all of which the position is closed with 50 pips return.
Want to know more?
Pleae check out the following webinar from minute 19 onwards if you want to know more about these Attributes.