This information is of vital importance because Darwinex replicates trading strategies by standardizing the risk to a monthly target VaR (95% confidence) within the range of 3.25%-6.5%.
As such all DARWINs are comparable in terms of their expected risk.
The more stable the trading strategy's risk, the higher the Rs score will be and vice versa.
Rs is scored from 0-10 and takes into account the last 12 D-Periods of Experience (Ex), with more recent periods having a higher weight in the calculation.
DARWIN vs. Underlying Strategy
The Darwinex Risk Engine transforms the Underlying Strategy into a financial asset - a DARWIN -with a 6.5% monthly target VaR (95% confidence interval).
The more stable the Underlying Strategy's risk, the easier it is for the Risk Manager to faithfully replicate the Underlying Strategy and the closer the monthly VaR of the DARWIN will be to the maximum 6.5%.
Many users assume that a good Risk Stability score necessarily implies conservative money management by the trader.
This is not the case however as Darwinex calculates the Risk Stability of a strategy independently of the VaR with which the trader operates.
It is not the absolute level of VaR with which the trader operates, but the stability of the same that determines the Rs score.
Why is this?
Because replicating at a maximum of 6.5% target VaR is not the same if the VaR of the underlying strategy fluctuates between 8% and 16% - a doubling of the risk - than if it fluctuates between 40% and 44% (a 10% increase in risk).
The first example will have a lower Rs score than the second.
Where can I see the Risk Stability (Rs) Score?
- DARWIN Profile
As with the other Investable Attributes you can find this information in the upper right corner of a DARWINs profile
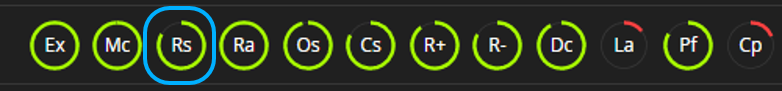
NOTE: By moving your mouse over any Investable Attribute you can see the score and a brief description of the attribute.
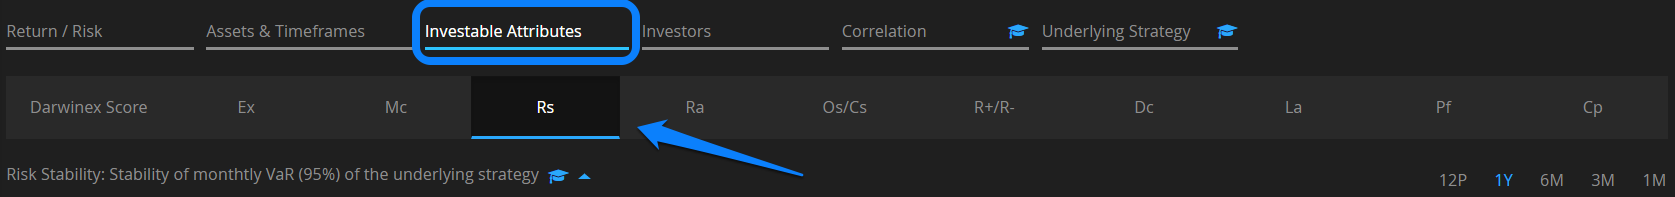
- Investable Attributes tab
Within a DARWINs profile, click on the Investable Attributes tab and then on Rs in the horizontal menu.
Both paths bring you to a graph showing the evolution of the monthly VaR of the underlying strategy at the 95% confidence interval level.
In order to better visualise the risk, there is a shaded area with three lines:
- The upper line shows the maximum VaR in the last 45 trading days at a given point for which positions were opened
- The lower line shows the minimum VaR in the last 45 trading days at a given point for which positions were opened
- The centre, coloured line, shows the actual level of VaR at a given point in time
NOTE: The vertical axis of the Rs graphs is shown with a logarithmic scale.
Examples of the Risk Stability score
If you are an investor, bear in mind that the higher the Risk Stability (Rs) score, the greater the similarity in the return curves of the DARWIN and the Underlying Strategy it replicates.
This is not to say that returns will be exactly the same but there should be a shared similar behaviour marked by consistent correlation.
Let's look at some example of DARWINs with high and low Rs Scores
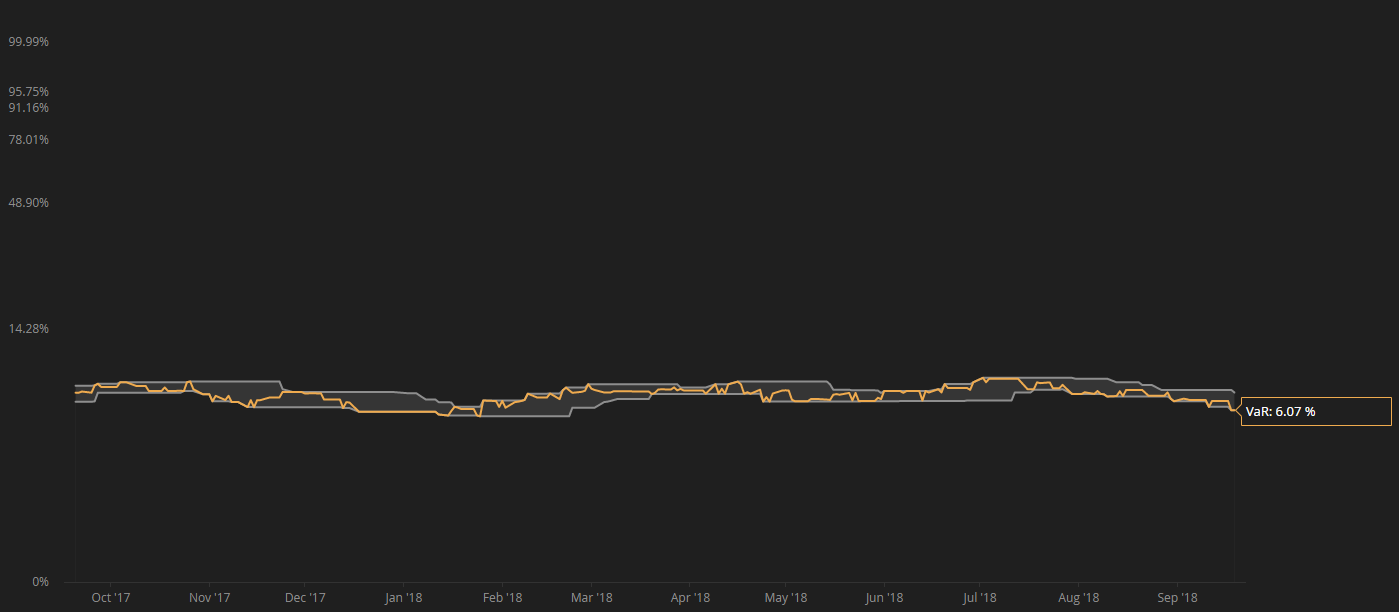
- High Rs Score (low VaR)
This is an example of a DARWIN with a high Rs score and low VaR.
Observe that the upper and lower bands do not fluctuate excessively.
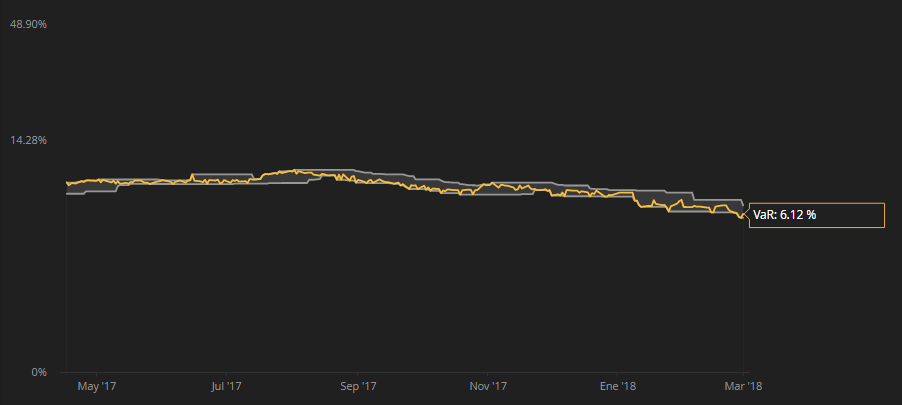
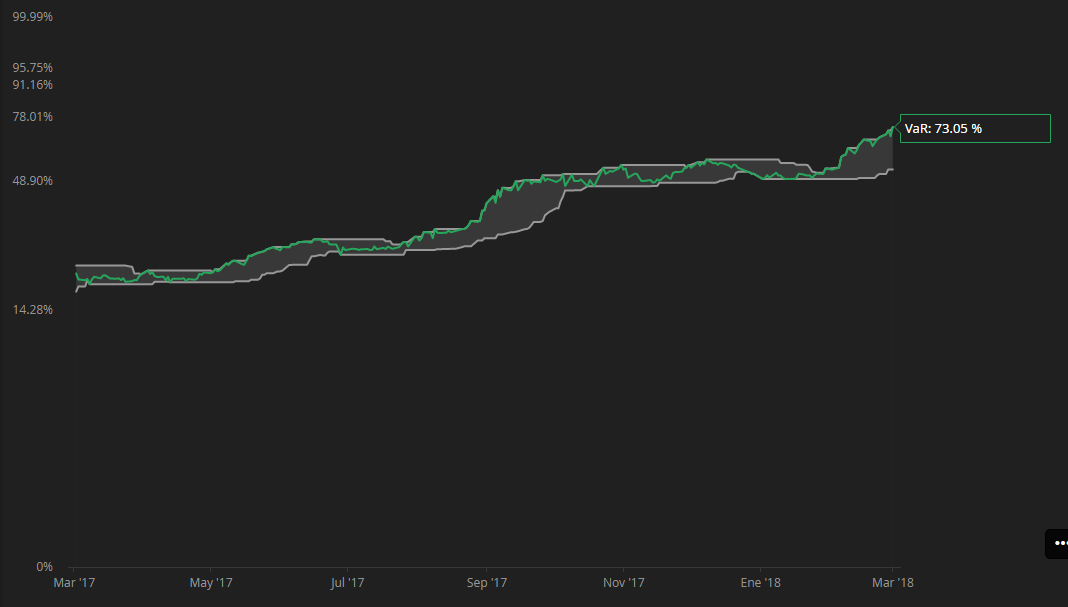
- High Rs Score (high VaR)
In this example, you can see that the VaR of the strategy has increased substantially (see logarithmic scale on Y-axis), but that this increase has been managed in a controlled and relatively gradual way.
Consequently, our algorithms determine that the risk management has been stable and award a good Rs score.
As explained above, the fact that the trader operates with a high VaR in his underlying strategy - something dangerous for his account - does not necessarily imply a lower Rs score.
It is the stability of this VaR and not the absolute level, which is important.
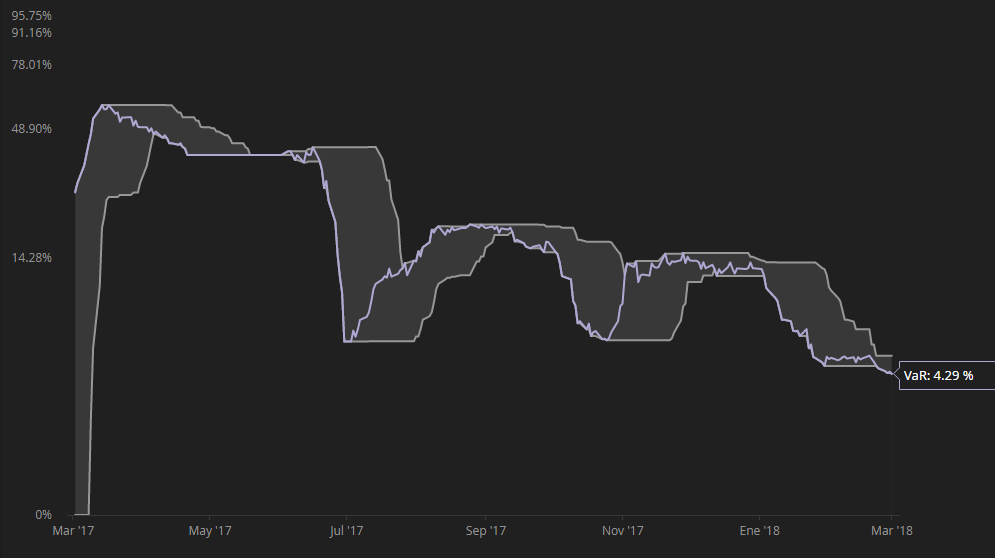
- Low Rs score (low VaR)
In the below example you can see that while the trader currently has a low VaR (4,29%), the absolute level has fluctuated wildly.
As a result of these fluctuations, the Rs score is also low.
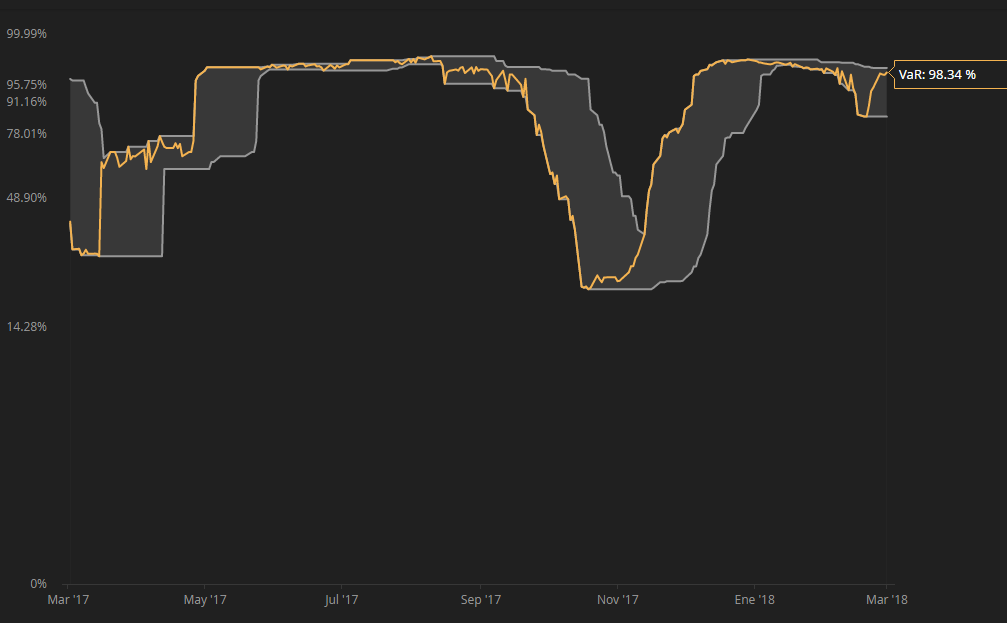
- Low Rs score (high VaR)
Lastly, we have an example of a strategy with a high VaR which also has wild fluctuations.
This combination of low Rs and high VaR means that the return curves of the DARWIN and the underlying strategy will not be so similar.
Investors should be especially careful with strategies demonstrating this combination of low Rs and high VaR.
Tips
1. Relationship between the DARWIN and its Underlying Strategy
The Rs attribute combined with the VaR of the underlying strategy allows us to preview how the DARWIN will behave in relation to its underlying strategy.
- If the VaR of the underlying strategy is greater than 6.5%, the DARWIN will win/lose less than the underlying strategy
- If the VaR of the underlying strategy is less than 6.5%, the DARWIN will win/lose more than the underlying strategy.
For further information on the differences between a DARWIN and its underlying strategy check this article.
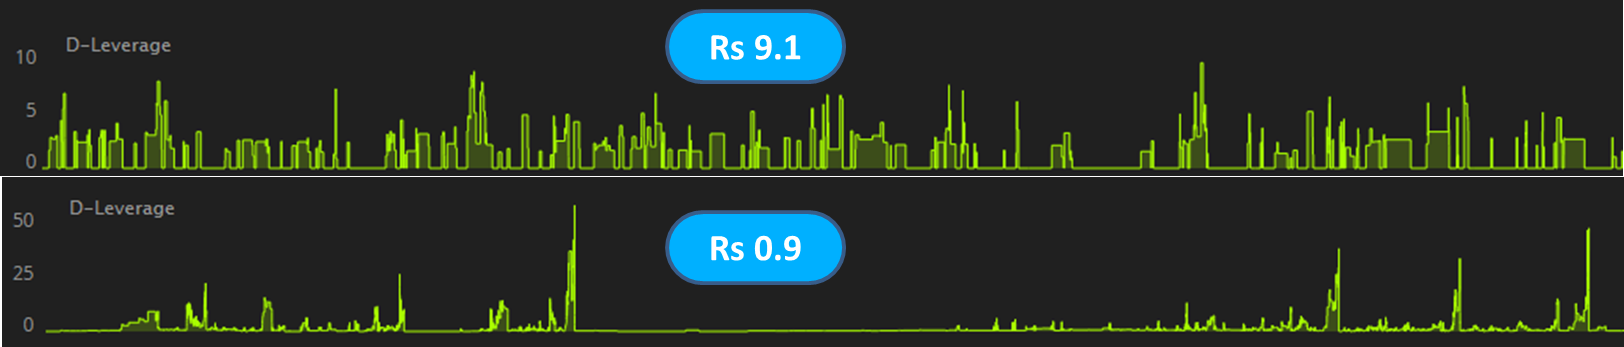
2. Rs in the Trading Journal
A DARWIN investor with a certain amount of experience will be able to gain an idea of the Rs score by looking at the Trading Journal in the underlying strategy.
If you observe erratic peaks in the D-Leverage, the Rs score will almost certainly be low, while if the peaks are relatively homogenous, the Rs score will be good.
3. Customize your target risk level
One of the reasons why a DARWIN has a known target risk - maximum 6.5% monthly VaR - is so that investors know the risk they are undertaking well in advance.
This fixed risk allows an apples to apples comparison of DARWINs facilitating investment decisions for investors.
If an investor wanted to invest in a DARWIN with a VaR lower than 6.5%, he/she can adjust the amount of money they invest in the DARWIN to customize the target risk level.
A constant target VaR means the investor can adjust his $ risk according to personal preferences.
Let's use an example of an investor with a conservative risk profile who wants to invest € 10,000 in a DARWIN, but who considers their risk tolerance as 2% VaR i.e less than 3 times the risk of a DARWIN.
To meet his/her risk objective, they will need to invest 2/6.5=0.3076 of their originally desired amount i.e € 3,076.
As such, both scenarios shown below imply the same monetary amount of risk:
- Invest € 3,076 in a DARWIN with VaR of 6.5%
- Invest €10,000 in a DARWIN with VaR of 2%
Want to know more?
We recommend the following webinar should you want to know more about the Rs attribute.