What are they?
As a result of years of extensive research analyzing trading strategies, the Investable Attributes (IAs) are one of the fundamental pillars on which Darwinex' bases its ability to determine the quality of trading strategies with the least possible number of parameters.
.jpg)
If you had to assess the quality of a trading strategy:
- How would you do it?
- Which factors would you consider?
- What data would you analyze?
The vast majority would answer that profitability determines the quality of a strategy.
However, we think that it cannot be further from the truth.
Profitability may offer a distorted vision when assessing the quality of trading strategies, since the bottom line may have been the result of pure luck, due to:
- Endogenous circumstances that have nothing to do with the trader's ability.
- Exogenous circumstances, such as risk management.
Having the "fortune" that the most leveraged trade is the most profitable, use of "martingale" systems, etc.
Therefore, if profitability is not what that determines the quality of a strategy...
What is it then?
At Darwinex we measure the skill and talent of traders thanks to 12 Invertible Attributes so that the entire investment community can evaluate and compare DARWINs since they all trade with the same risk target (maximum 6.5% monthly VaR).
In addition, we not only offer a full analysis of the strategies & DARWINs, but we do it without showing their trading history so that nobody could copycat a DARWIN without paying for it.
Luck is ephemeral and has an expiration date. However, skill and talent can endure for ever.
Investable Attributes Principles
Each real strategy in Darwinex will be analyzed by our 12 "talent detectors" and will award a score of 0 to 10 in each of them.
Additionally, all of them meet the following criteria:
- Uncorrelation => Each attribute is independent of the rest.
- No Attribute analyzed in isolation determines the quality of a strategy.
Our 12 Investable Attributes
In this section, you will get a first approximation to the twelve Investable Attributes of Darwinex.
We have prepared specific articles about each of them so you can meet them "in private".
1. Experience (Ex)
The Experience Investable Attribute (Ex) measures the statistical significance of the data of a DARWIN / trading strategy, giving a score of 0 to 10.
The greater the track record, the greater its statistical reliability. It is obvious that the same conclusions can not be drawn after analyzing a dozen trades that after having analyzed tens of thousands.
At Darwinex, we have designed proprietary algorithms that measure the Experience (Ex) by counting the number of representative decisions in a DARWIN.
For your information, Experience (Ex) is the only Attribute that can only grow until it reaches its maximum score of 10.
We recommend reading the article about Experience (Ex) to understand the logic behind it.
2. Market Correlation (Mc)
The Market Correlation (Mc) Investable Attribute measures the added value provided by the trading decisions of the DARWIN provider, and compares the result with the evolution of the underlying assets in which it operates. That is, it assesses the dependence of a DARWIN on its underlying assets.
A higher grade means that the DARWIN trades have less dependence on the underlying assets, since it trades in both market directions and does not remain in a single direction for an extended period of time.
An investor is willing to pay 20% of the return obtained with a DARWIN, since he considers that the DARWIN provider adds value that must be rewarded.
With the Mc we measure what proportion of the final result is due to the intrinsic evolution of the underlying assets in which the strategy operates.
3. Risk Stability (Rs)
Risk Stability (Rs) measures how stable the DARWIN’s underlying strategy’s VaR has been in the last 12 D-periods. The higher the score, the more stable the risk, hence:
- The more proportional the DARWIN’s behaviour vs. its underlying strategy, and
- the more likely the DARWIN will trade with a 6.5% VaR target risk.
4. Risk Adjustment (Ra)
Risk Adjustment (Ra) measures on a scale of 0 to 10 how often our Risk Engine intervenes to protect investors from excessive risk in the trader’s strategy.
The higher the score, the less often our Risk Engine has to intervene, hence:
- The more proportional the DARWIN’s behaviour vs. its underlying strategy, and
- The more likely the DARWIN will trade with a 6.5% VaR target risk.
5. Open Strategy (Os)
The Open Strategy (Os) Investable Attributes measures if the strategy would have performed better by systematically opening trades a bit earlier or later and calculates the quality in the entry by comparing their profitability with that of 10 simulations that enter either a bit earlier or a bit later than the trader.
The higher the score, the better the trader’s decisions to enter the market.
6. Close Strategy (Cs)
The Close Strategy (Os) Investable Attributes measures if the strategy would have performed better by systematically closing trades a bit earlier or later and calculates the quality in exiting the market by comparing their profitability with that of 10 simulations that exit either a bit earlier or a bit later than the trader.
The higher the score, the better the trader’s decisions to exit the market.
7. Positive Return Consistency (R+)
Positive Return Consistency (R+) measures if the trader follows an identifiable pattern in its trading decisions that end up in the green.
The better the R+ grade, the more the evidence that the trader uses the profitability of their positive positions as a criterion to close them.
8. Negative Return Consistency (R-)
Negative Return Consistency (R+) measures if the trader follows an identifiable pattern in its trading decisions that end up in the red.
The better the R- grade, the more the evidence that the trader uses the losses in their negative positions as a criterion to close them.
9. Duration Consistency (Dc)
Duration Consistency (Dc) measures if the trader follows an identifiable pattern in its trading decisions based on the duration of its trading positions.
The better the R- grade, the more the evidence that the trader uses the duration of its positions as a criterion to close them.
10. Loss Aversion (La)
Loss Aversion (La) Investable Attribute evaluates whether a trading strategy exhibits symmetric behaviour independently of whether a position is winning or losing.
Many traders demonstrate an inability to close losing positions, often accumulating significant losses in the forlorn hope that the market will reverse course. These same traders often exhibit a tendency to close winning positions too early, prematurely taking profits.
Darwinex considers this behavioural bias extremely dangerous, especially if it is combined with significant levels of leverage.
11. Performance (Pf)
The Performance (Pf) Investable Attribute compares the risk-adjusted return of a DARWIN (maximum 6.5% monthly VaR) against the returns of 10,000 random strategies with exactly the same level of risk. It then ranks them on a percentile basis from 1% to 99%.
The spirit is similar to Sharpe/Sortino ratios, but the implementation overcomes shortcomings that arguably render Sharpe/Sortino unfit to assess high-risk, high rotation trading strategies.
12. Capacity (Cp)
The Capacity (Cp) Investable Attribute evaluates how the returns of investors in a DARWIN are impacted by additional investment in the DARWIN.
The better the score, the more likely it is that the DARWIN can sustain substantial levels of investment without suffering divergence that negatively impacts investors.
Where can you see them?
- In the DARWIN main profile
- In the underlying trading strategy profile
Investable Attributes Section
On the upper right part of all the DARWIN profiles, you will find a section with the 12 Investable Attributes surrounded by a colored circle.
Colour varies depending on the grade given by our algos.
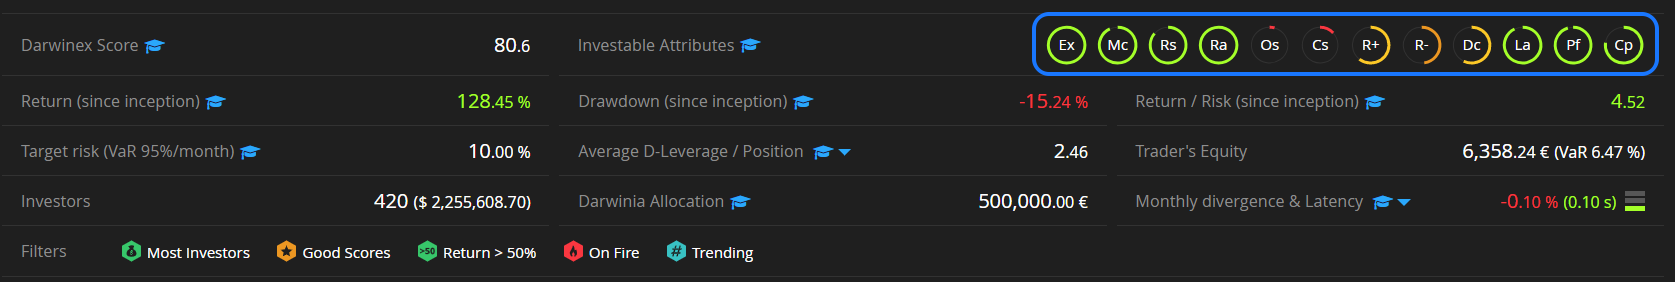
If you hover the mouse over the circle you will see the corresponding grade, as well as a brief description of each Attribute.
In addition, by clicking on any of them, you will open the corresponding analysis chart.
The "Investable Attributes" tab
Here you can perform a much more detailed analysis of the Investable Attributes, which will allow you to know more about the quality of the DARWIN Provider.
Remember that in each Attribute you will find a graduation cap that will forward you to a specific lesson where we will explain, with great detail, all the ins and outs of it.

Do you want to know more?
If you want to know more about the Investible Attributes, we encourage you to watch the recording of the following webinar.