Introduction

Nominal leverage & risk...
The most common way of measuring the risk of a trade is through its nominal leverage.
This is done by dividing the nominal volume of a trade by the account's equity. Thus, a trade with a leverage of 5:1 is equivalent to opening a volume 5 times superior to said account's equity.
Therefore, we can reach the conclusion that the greater the leverage, the greater the risk.
However, nominal leverage is not the only relevant thing for measuring the risk, there is another fundamental factor: volatility.
...and volatility
At the risk of oversimplifying, it is not the same thing to have a trade, with a nominal leverage of 5:1 on the EURUSD, as one with the same leverage on the NDX (Nasdaq), as this last trade would tend to be a lot more volatile than EURUSD.
Consequently, the greater the volatility, the greater the risk, because the asset quote price can move further in a unit of time, and ''more things could happen''.
D-Leverage measures the risk of a trading decision per position
At Darwinex we have created our own way of measuring the risk per position - not per trade-, which is represented by the metric D-Leverage.
This takes into account the following variables:
- Nominal leverage of each one of the trades opened simultaneously.
- Asset's volatility, or the combination of assets that make up such position.
- Correlation: we measure the correlation of all the assets opened simultaneously which constitute the trading position. The greater the correlation, the greater the risk, and viceversa.
- Duration: Compares the volatility in terms of the EURUSD for that time period.
The final result is standardized in terms of the EURUSD. Therefore, a position with a D-Leverage of 3, would be the same as opening a trade on the EURUSD with a nominal leverage of 3:1.
This way of measuring the risk of any position, taking as a reference the EURUSD, is called the D-Leverage.
Thanks to the D-Leverage, you will be able to compare the risk of all your trading positions regardless of the assets it includes, the type of strategy, etc.
Case study
In this example, we are going to show you how D-Leverage evolves in the following three positions.
Imagine that:
- You open a trade long on the USDCAD with a nominal leverage of 7:1.
- Before closing the trade, you open a trade short on the GBPJPY with a nominal leverage of 5:1.
- You close the USDCAD.
- A bit later you decide to close the GBPJPY.

During this time period, you can see 3 distinct phases:
- Position nº1 => made up of a long trade on the USDCAD 7:1
- Position nº2 => consists of two trades: long on the USDCAD 7:1 and short on the GBPJPY 5:1
- Position nº3 => made up by a short trade on the GBPJPY 5:1
How is the D-Leverage calculated?
(Bear in mind that, for a time, trades with different nominal leverage and volatility coincide.)
Let's suppose that, when you open the trades, the volatility of these two pairs in relation to the EURUSD is the following:
- USDCAD is 40% less volatile than the EURUSD
- GBPJPY is 20% more volatile than the EURUSD
You can see on the graph how the 3 positions progress across time:
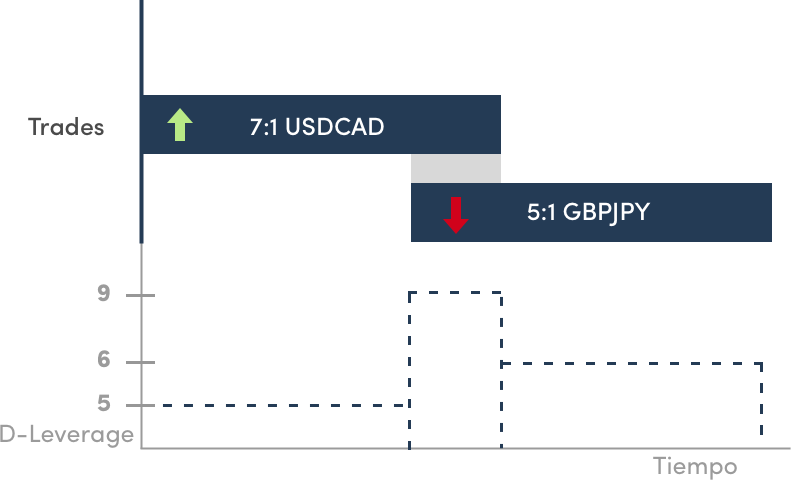
You can see that the D-Leverage has changed its value across the 3 positions in the following way:
- Position nº1 => In this phase there is only one trade open long on the USDCAD, with a nominal leverage of 7:1. However, as in our example, the USDCAD is 40% less volatile than the EURUSD, so the position's D-Leverage will be 5.
- Position nº2 => This position is made of two trades with different leverage and volatility. To simplify the calculation, let's suppose that the sum of both leverages adjusted to the volatility of the EURUSD, and taking into account the correlation of a long trade on the USDCAD and another short trade on the GBPJPY, D-Leverage is 9.
- Position nº3 => Lastly, there is only one short trade open on the GBPJPY in the third position with a D-Leverage of 6, since it is 20% more volatile than the EUUSD.
The value of the D-Leverage has changed over this 3 positions based on nominal leverage, volatility and the correlation between all the assets open simultaneously.
Tips
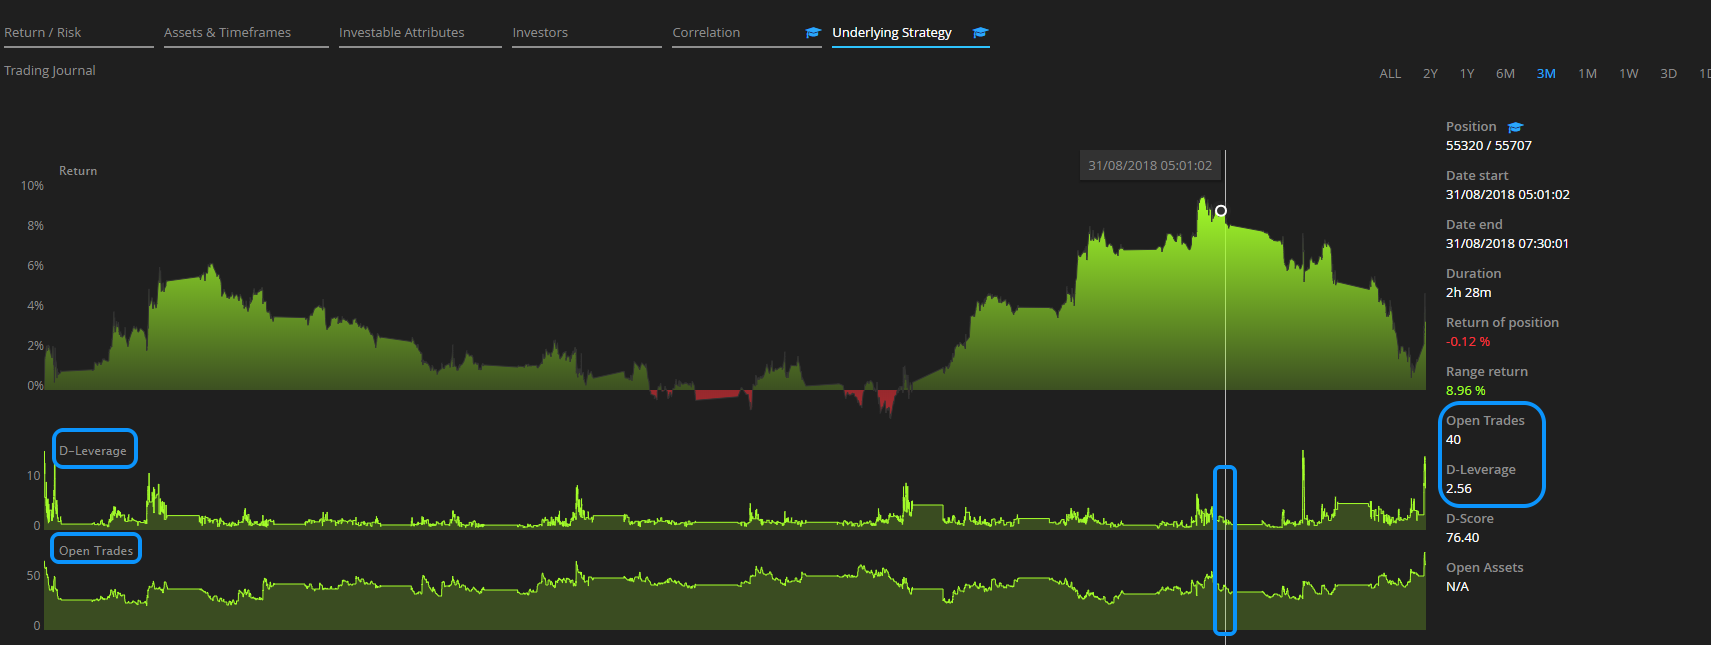
1. D-Leverage chart
In the ''Underlying Strategy'' tab of any DARWIN, you will be able to analyze the progress of a strategy's return, together with the D-Leverage and the number of trades opened simultaneously on each position.
2. Risk Adjustment Investable Attribute Graph (Ra)
In the "Investable Attributes" / "Ra" tab, you can analyze both the D-Leverage as well as the duration of each position on the underlying strategy.
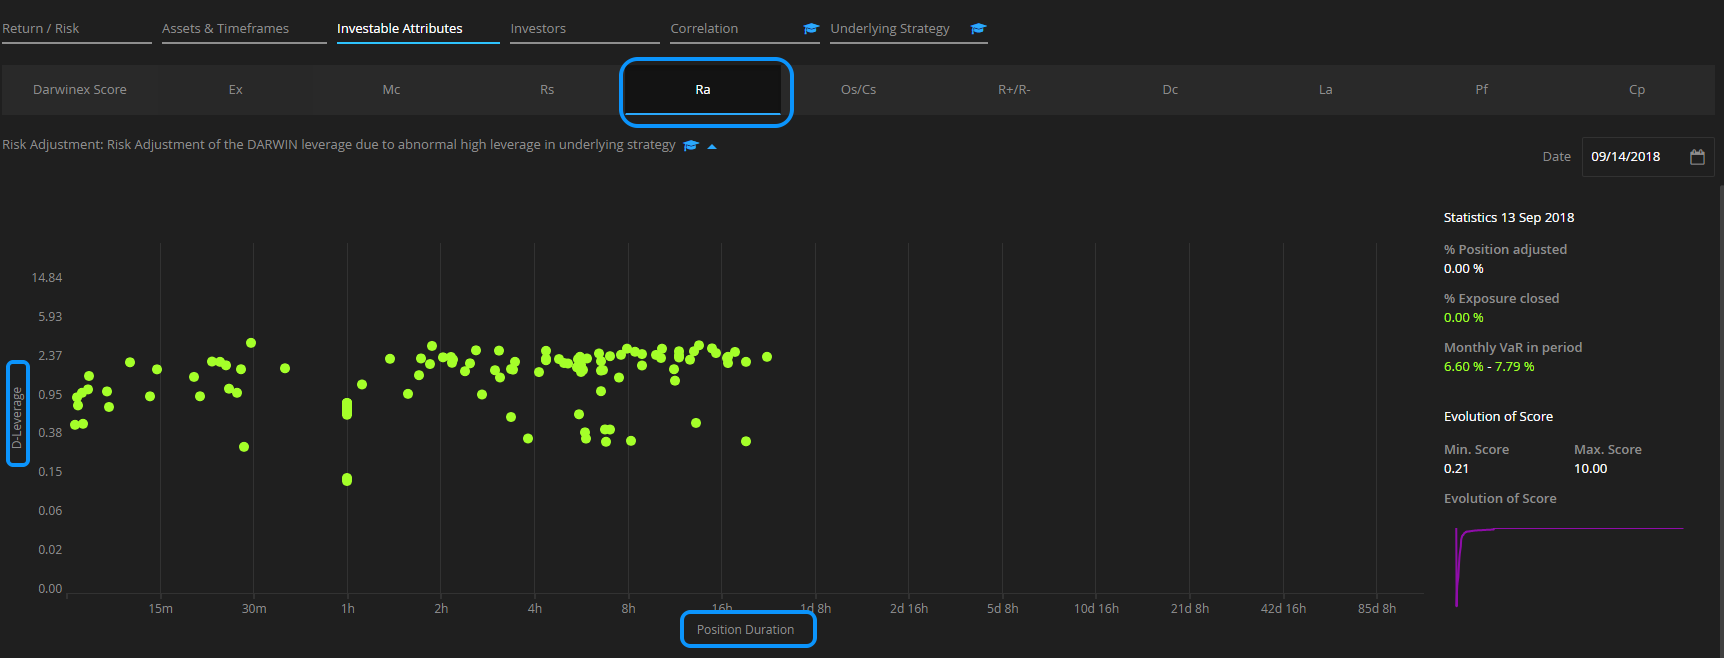
You may read more about the Risk Adjustment (Ra) Investable Attribute HERE.
Learn more
Measuring the Risk of a Trading Decision (D-Leverage)
This tutorial makes a case for the need to measure the risk of a trading strategy in terms of trading decisions instead of using the volatility of past returns.
We introduce our proprietary metric, D-Leverage, discuss the motivation behind it and make a case for how it helps us in better approximating a more realistic Value-at-Risk for any given trading strategy.
Calculating the Risk (D-Leverage) of a Position
In this tutorial, we describe in detail how to calculate the risk of a trading position in terms of D-Leverage.
The concept of position is introduced: what they are & how they are constructed.
We conclude with a discussion on Control values that D-Leverage is bound by, a measure that enables us to ensure that the risk calculated for any given position is indeed representative of the actual risk the trader is taking at that point in time.