What is it?
The divergence is the difference between the return obtained by investors in a DARWIN and the theorical return of a DARWIN. It is shown as a percentage and its value can be either negative or positive.
From a technological standpoint, it is impossible to replicate both traders' and investors' trades identically, therefore there will always be some divergence.
Currenlty, DARWIN's return is displayed taking as a reference investor's final return (which means is net of divergence), but it may happen past returns on a DARWIN has divergence excluded, as divergence was originally a value not incorporated in the DARWINs' profitability graphs.
Why is it caused?
Investors may experience divergence due to 2 reasons:
1. Latency
Due to technological reasons, investors' trades are always replicated with a delay of a few milliseconds compared with those of the traders so, in that brief space of time, the market conditions can alter and as such the price at which the trades are executed.
As in the case of the base currency, divergence due to latency is random.
2. Investor volume
This is the main cause of systematic divergence. It happens when the capital under management in a DARWIN is high enough that when it tries to execute a large volume trade it causes slippage in the market price, offering a worse execution price to investors than the one obtained by the trader.
All things being equal, the higher the volume invested in a DARWIN, the higher the chances investors might have of experiencing a negative divergence.
Divergence due to differences in base currency between the trader and the investor are displayed within currency impact value.
How can you analyse the divergence?
You can find information about a DARWIN's divergence in the following sections:
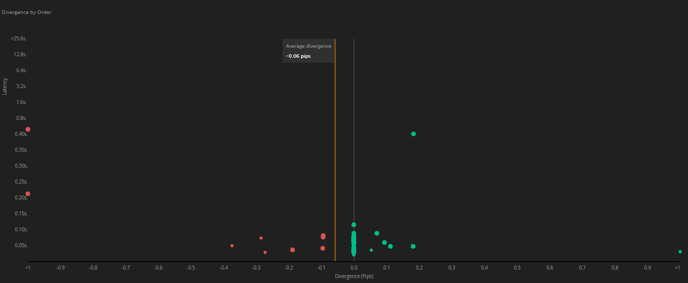
Divergence by order
On the ''Investors'' tab, there is a graph with dots in different colours and sizes, which represent the orders executed for investors.
The vertical axis represents the latency in milliseconds, and the horizontal axis shows the divergence in Pips (red dot = negative divergence; green dot = positive divergence).
Here you can see the difference in execution between the trader and the investors trades over the last 100 orders.
Used capacity
Used capacity is defined as the maximum percentage of either:
1. Current divergence / maximum divergence allowed.
2. Currente capital invested / Maximum amount of capital under management admitted.
This means that if the used capacity of a DARWIN is 75% (given that maximum standard divergence allowed is -1% and let's say maximum amount of capital set by the DARWIN provider is €10M), either the current divergence is -0.75% or the total investor's capital is €7.5M. From this information current divergence may be deducted as well.
DARWIN backtesting tool and divergence
It is possible to check historic divergence of a DARWIN by using DARWIN backtesting tool. This feature allows you to analyse the historical performance of a DARWINs investment portfolio, including any historical divergence. By comparing the performance of a DARWIN in the backtest and the historical performance chart of a DARWIN, the divergence can be extracted.
In addition, the tool is enabled to add investor leverage, select different timeframes, and shows the corresponding management and performance fees that would correspond to the results.
In short, it is the best way to make simulations and analyse the final results received as an investor.
How to see the impact on your investment
From the DARWIN's Investment Platform, on the ''Invested DARWINs'" tab, and reflected in the ''Currency impact'' column, you will be able to see the live accumulated divergence that you have in each of the DARWINs you have invested in the past, if any.
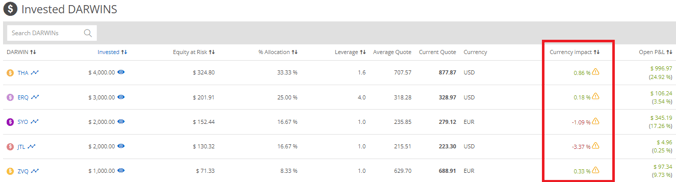
A currency impact of -1.09% means that the return of your investment in this DARWIN is down 1.09 % than the notional return of the DARWIN since you invested in it.
You can calculate the notional return of the DARWIN by dividing the DARWIN's current quote by the average quote at which you bought the DARWIN.
The difference between this return and your actual return is your currency impact (and past divergence, if any).
Tips
When it comes to analysing DARWINs, we recommend you to bear the following tips in mind.
Use DARWIN backtesting tool
DARWIN backtesting tool is the best feature to make simulations of real performance achieved as an investor, as you can select the timeframe, DARWINs invested, investor leverage, and it would include all relevant factors in terms of past divergence, currency impact, and management & performance fees.
Beware of DARWIN Capacity (Cp) score and capital under management.
Investors should bear in mind that DARWIN's Capacity score is directly correlated to the amount of investment they will be able to accumulate without affecting the profitability of their DARWIN. The better the capacity score, the more investors the DARWIN will be able to accumulate without affecting performance.
This means that if a DARWIN performs well with very few investors, and has a low capacity score, it may be possible that the DARWIN's performance will be worse as the volume under management increases substantially.
Demo portfolios
Results in demo portfolios may differ from live.
Demo portfolio orders are sent from a demo server, which is different from our live server.
Demo execution might not reflect the differences that might exist between the market depth seen in the order book and the real market depth (which do exist in a live environment), so the currency impact could show some differences from demo to live.
Do you want to learn more?
If you want to learn more about divergence, we recommend the recording of the following webinar presented by our CEO, Juan Colón: